AP Statistics: Study Guide - EBSCO Connect
A relative frequency table gives the proportion of the total that is accounted for by each category. For example, in the previous data, 14 of the 50 cars, or 28%, were black. The full relative frequency table is as follows: Color Relative Frequency Black 28% Red 12% Blue 10% Silver 22% White 12% Green 6% Yellow 2% Grey 8%
Download AP Statistics: Study Guide - EBSCO Connect

Information
Domain:
Source:
Link to this page:
Documents from same domain
AP European History: Study Guide - EBSCO Connect
support.ebsco.comThis guide will give you a review of all major exam topics, with an emphasis on the key people, places, events, and documents of each time period. Following every topic overview are sample AP multiple-choice or short answer exam questions, so you can get a sense of how information will be presented on test day. Lets get started! 1
AP Chemistry Study Guide - EBSCO Connect
support.ebsco.comThe AP® Chemistry exam is a 3-hour 15-minute, end-of-course test comprised of 60 multiple- ... • Applications of Thermodynamics: 7–9% of test questions ... Atoms are the fundamental unit of matter, and the smallest unit that retains all the properties
AP US Government and Politics Study Guide
support.ebsco.comThe AP U.S. Government and Politics exam will test your knowledge of material typically covered in a one-semester college introductory-level course about U.S. government and politics. The 3-hour exam is comprised of 55 multiple-choice questions (50% of the exam) and 4 free-response questions (50% of the exam). The exam covers the following topics:
AP Chemistry Study Guide - EBSCO Connect
support.ebsco.comenergy subshell 3d is not full and only has 6 of 10 possible electrons. Thus, accordingto Hund’s rule, 4 of the 5 orbitals will have one electron and 1 orbital will have two electrons. The direction of an arrow in this diagram indicates the spin of an electron, either spin up or spin down.
AP European History: Study Guide - EBSCO Connect
support.ebsco.comAmericas for the Roman Catholic Church. The correct answer is A. Queen Isabella commissioned Columbus to seek a new route to Asia that bypassed trade routescontrolled by the Ottomansand Portuguese. While olumbus [ voyages ultimately led to Spanish control over large portions of the Americas, neither Columbus
AP US Government and Politics Study Guide
support.ebsco.com• American Political Beliefs and Ideologies: 10–15% of test questions This guide will give you a review of all major exam topics, with an emphasis on the terms covered in each exam section. Following every topic overview are sample AP multiple-choice ... new government abandoned the system of Confederation in favor of a system of federalism,
GED TEST REASONING - EBSCO Information Services
support.ebsco.commultiple-choice . questions will still be the main type you will see on the RLA test, and each item will have four possible answer choices to select from. This is a change from previous GED® tests, which had five choices for each multiple-choice item. There is still only one correct answer choice for each item.
AP Calculus AB Study Guide - EBSCO Information Services
support.ebsco.comvalue of the left-sided limit at 5. The right-sided limit at 5 is 0. The limit in choice C is actually equal to 6. Remember, a function need not be defined at an x-value in order to have a limit there. Choice D is incorrect because even though F(2) = 3, the y-values get close to 2, not 3. Compute the limit: sin( ) lim 3 x 2 x x S x S o SS ª º ...
Quantitative, and Verbal test sections - support.ebsco.com
support.ebsco.com501 GMAT ® Questions will familiarize you with the Graduate Management Admission Test (GMAT ®) and its format. When you take the test, remember that the GMAT is a computer adap-tive test (CAT), which means that as you answer each question, a harder question or an easier question will appear. Therefore, you will not be able
AP Calculus BC Study Guide - EBSCO Information Services
support.ebsco.comThe AP® Calculus BC exam is a 3-hour 15-minute, end-of-course test comprised of 45 multiple-choice questions (50% of the exam) and 6 free-response questions (50% of the exam). The exam covers the following course content categories: • Limits and Continuity: 4–7% of test questions
Related documents

Chapter 2: Frequency Distributions and Graphs (or making ...
math.ucdenver.eduCh2: Frequency Distributions and Graphs Santorico -Page 30 For quantitative variables we have grouped and ungrouped frequency distributions. An Ungrouped Frequency Distribution is a frequency distribution where each class is only one unit wide. Meaningful when the data does not take on many values.
jmp.com/learn rev 07/2012 Bar Charts and Frequency ...
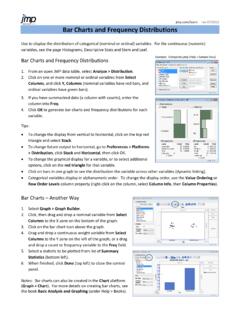
www.cs.uni.eduBar Charts and Frequency Distributions Use to display the distribution of categorical (nominal or ordinal) variables. For the continuous (numeric) variables, see the page Histograms, Descriptive Stats and Stem and Leaf. Bar Charts and Frequency Distributions 1. From an open JMP data table, select Analyze > Distribution. 2.
Using R: Frequency Distributions, Histograms, Scatterplots ...
cosmosweb.champlain.eduThen we created a relative and cumulative frequency table from this. Frequency Distribution: Males Scores Frequency 30 - 39 1 40 - 49 3 50 - 59 5 60 - 69 9 70 - 79 6 80 - 89 10 90 - 99 8 Relative Frequency Distribution: Males Relative Scores 30 - 39 2.4% 40 - 49 7.1% 50 - 59 11.9% 60 - 69 21.4% 70 - 79 14.3% 80 - 89 23.8% 90 - 99 19.0% ...
in Public Health Practice
www.cdc.govNov 04, 2011 · Prepare and apply tables, graphs, and charts such as arithmetic-scale line, scatter diagram, pie chart, and box plot. Describe the processes, uses, …
WORKSHEET – Extra examples
www.math.utah.edu2.1 Frequency Distributions and Their Graphs Example 1: The following data set lists the midterm scores received by 50 students in a chemistry class: 45 85 92 99 37 68 67 78 81 25 97 100 82 49 54 78 89 71 94 87 21 77 81 83 98 97 74 81 39 77
Section 2.1, Frequency Distributions and Their Graphs
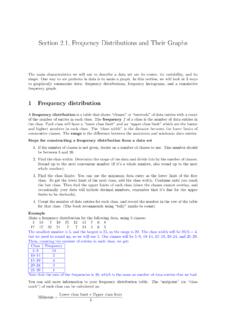
www.math.utah.eduSection 2.1, Frequency Distributions and Their Graphs The main characteristics we will use to describe a data set are its center, its variability, and its shape. One way to see patterns in data is to make a graph. In this section, we will look at 3 ways to graphically summarize data: frequency distributions, frequency histograms, and a cumulative
![Describing and Comparing Data Distributions [Teacher Version]](/cache/preview/4/8/8/1/a/a/7/d/thumb-4881aa7da51f684046f4244443a3c04f.jpg)
Describing and Comparing Data Distributions [Teacher Version]
www2.census.govdifferent levels (city or town, county, and state) to compare and contrast the distributions of these variables in graphs, analyzing the shape, center, and spread of each. Suggested Grade Level: 9 Approximate Time Required: ... • Frequency – the number of times a value occurs in a data set • Interquartile range (IQR) – a measure of ...
Frequency Distributions - University of Notre Dame
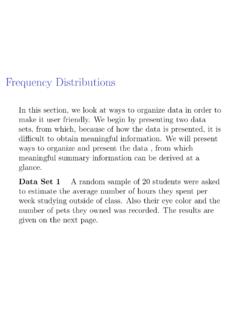
www3.nd.eduFrequency Table or Frequency Distribution Example: Data Set 1 Here are frequency distributions for the data on eye color and number of pets owned. (Note that we lose some information from our original data set by separating the data) Eye Color # of Students (Category) ( Frequency) Blue 4 Brown 6 Gray 2 Hazel 5 Green 3 Total 20 # Pets # of Students