
Chapter 2: Simple Linear Regression
R2 = 425.63910 427.79402 = 0.995, and thus about 99.5% of the variability in the ob-served values is explained by boiling point. In the below, we list some properties of R2. 1. The range of R2 is 0 ≤ R2 ≤ 1.
Download Chapter 2: Simple Linear Regression

Information
Domain:
Source:
Link to this page:
Documents from same domain
Integre Technical Publishing Co., Inc. …
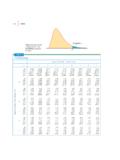
www.stat.purdue.eduTables • T-13 Table entry for p is the critical value F∗ with probability p lying to its right. F* Probability p TABLE E F critical values (continued) Degrees of …
Analysis of Repeated Measures - Purdue University
www.stat.purdue.eduRepeated Measures, STAT 514 1 Analysis of Repeated Measures Hao Zhang 1 Introduction In many applications, multiple measurements are made on the same experimental units over a period
Chapter 19 Split-Plot Designs - Department of …
www.stat.purdue.eduChapter 19 Split-Plot Designs Split-plot designs are needed when the levels of some treatment factors are more difficult to change during the experiment than

Introduction to Genetic Association Studies
www.stat.purdue.eduTopic Introduction Introduction to Genetic Association Studies Cathryn M. Lewis and Jo Knight Genetic association studies are used to find candidate genes or genome regions that contribute to a
Chapter 6: Confidence Intervals and Hypothesis Testing
www.stat.purdue.eduState your conclusion about the data in a sentence, using the P‐value and/or comparing the P ‐value to a significance level for your evidence. STEP 1: State the null hypothesis H …
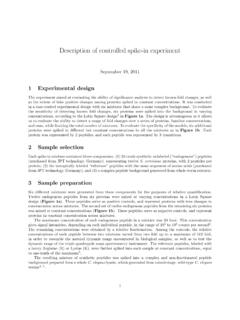
Description of controlled spike-in experiment
www.stat.purdue.eduDescription of controlled spike-in experiment September 19, 2011 1 Experimental design The experiment aimed at evaluating the ability of signi cance analysis to detect known fold changes, as well

CV with Publications
www.stat.purdue.eduCurriculum Vitae S.V.N. Vishwanathan Teaching Selected Graduate Courses 2015 Advanced Machine Learning 2014 { 2015 Analysis of Algorithms 2011 { 2014 Introduction to Computing for Statisticians

6 Finite Sample Theory of Order Statistics and Extremes
www.stat.purdue.edu6 Finite Sample Theory of Order Statistics and Extremes The ordered values of a sample of observations are called the order statistics of the sample, and the
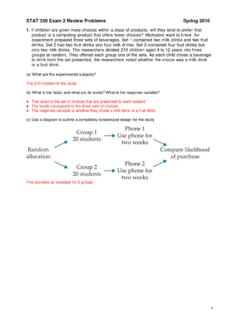
STAT 350 Exam 2 Review Problems Spring 2016
www.stat.purdue.eduSTAT 350 Exam 2 Review Problems Spring 2016 3 2. A random sample of 26 offshore oil workers took part in a simulated escape exercise, and their times (sec) to complete the escape are recorded. The sample mean is 370.69 sec and the sample standard deviation is 24.36 sec. Construct a 95% lower confidence bound on the true average escape time.

Mixed Models - Purdue University
www.stat.purdue.edu1 Introduction In many experimental design situations, one or more of the factors in the study may be random factors. That is, the levels of those factors are actually a sample from a larger population of levels and inferences are desired
Related documents
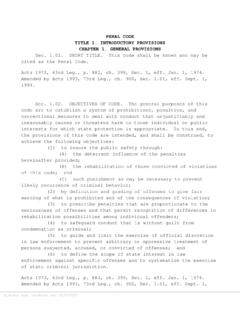
PENAL CODE TITLE 1. INTRODUCTORY PROVISIONS …
statutes.capitol.texas.gov(E) to harm the credit or business repute of any person; or (F) to take or withhold action as a public servant, or to cause a public servant to take or withhold action. PENAL CODE Statute text rendered on: 10/2/2021 - 4 - (10) "Conduct" means an act or omission and its

Preface - Cornell University
pi.math.cornell.eduen: an ncell, homeomorphic to the open ndisk Dn−∂Dn. In particular, D 0 and e 0 consist of a single point since R 0 ={0}. But S 0 consists of two points since it is ∂D 1 .

Tables of Constants for Control charts
web.mit.eduChart for Ranges (R) Chart for Moving Range (R) Median Charts Charts for Individuals CL X X ~ ~ = CL R = R CL X =X UCL X A R X 2 ~ ~ = + LCL X A R X 2 ~ ~ = − UCL R = D 4 R LCL R = D 3 R UCL X + E 2 R LCL X = X − E 2 R CL R = R UCL D R R = 4 LCL R = D 3 R 2 ~ A Institute of Quality and Reliability www.world-class-quality.com Control Chart ...

CHEMICAL ENGINEERING LABORATORY 3, CE 427 PACKED …
wwwcourses.sens.buffalo.edur (e) f e − ∆ ≡ 1 2 3 V L pg D f o c s p p Similar to7.19 in M & H. (1) Note that this equation cannot be derived directly by extrapolating the case of flow through a circular conduit since friction factor defined in both cases is different (see McCabe and Smith …
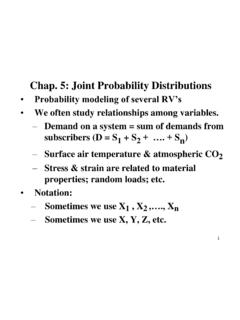
Chap. 5: Joint Probability Distributions
www.asc.ohio-state.edu1 Chap. 5: Joint Probability Distributions • Probability modeling of several RV‟s • We often study relationships among variables. – Demand on a system = sum of demands from subscribers (D = S 1 + S 2 + …. + S n) – Surface air temperature & atmospheric CO 2 – Stress & strain are related to material properties; random loads; etc.

Summary of Benefits and Coverage: What this Plan Covers ...
api.realfile.rtsclients.comis: the plan at 1-855-808-3568. You may also contact the Office of the Superintendent of Insurance (OSI) at 1-855-427-5674. Other coverage options may be available to you too, including buying individual insurance coverage through the Health Insurance Marketplace. For more information about the Marketplace, visit www.bewellnm.com or call 1-833 ...

Stata: Software for Statistics and Data Science | Stata
www.stata.comModel 427.990298 1 427.990298 Prob > F = 0.0005 Residual 489.873338 20 24.4936669 R-squared = 0.4663 Adj R-squared = 0.4396 Total 917.863636 21 43.7077922 Root MSE = 4.9491 mpg Coefficient Std. err. t P>|t| [95% conf. interval] weight -.010426 .0024942 -4.18 0.000 -.0156287 -.0052232 _cons 48.9183 5.871851 8.33 0.000 36.66983 61.16676

Syntax - Stata
www.stata.comModel 427.990298 1 427.990298 Prob > F = 0.0005 Residual 489.873338 20 24.4936669 R-squared = 0.4663 Adj R-squared = 0.4396 Total 917.863636 21 43.7077922 Root MSE = 4.9491 mpg Coef. Std. Err. t P>|t| [95% Conf. Interval] weight -.010426 .0024942 -4.18 0.000 -.0156287 …