
FREQUENCY-RESPONSE ANALYSIS
The above plots are in a natural scale, but usually a log-log plot is made This is called a “Bode plot” or “Bode diagram.” Reason for using a logarithmic scale Simplest way to display the frequency response of a rational-polynomial transfer function is to use a Bode Plot .
Download FREQUENCY-RESPONSE ANALYSIS

Information
Domain:
Source:
Link to this page:
Documents from same domain
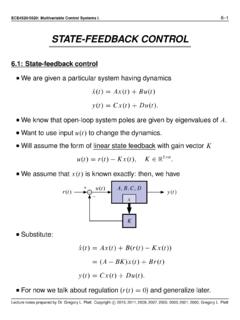
STATE-FEEDBACK CONTROL
mocha-java.uccs.eduECE4520/5520: Multivariable Control Systems I. 6–1 STATE-FEEDBACK CONTROL 6.1: State-feedback control We are given a particular system having dynamics x.t/P D Ax.t/CBu.t/ y.t/D Cx.t/CDu.t/: We know that open-loop system poles are given by eigenvalues of A. Want to use input u.t/ to change the dynamics.
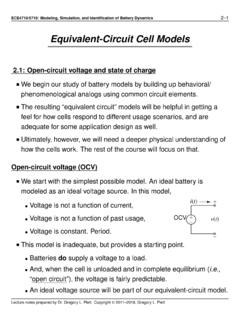
Equivalent-Circuit Cell Models
mocha-java.uccs.edu• Voltage is constant. Period. OCV v(t) i(t) − − + + This model is inadequate, but provides a starting point. • Batteries do supply a voltage to a load. • And, when the cell is unloaded and in complete equilibrium (i.e., “open circuit”), the voltage is fairly predictable. • An ideal voltage source will be part of our equivalent ...
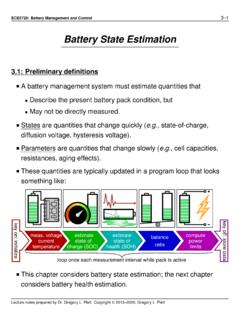
Battery State Estimation
mocha-java.uccs.eduModel-based state estimators implement algorithms that use sensor measurements to infer the internal hidden state of a dynamic system. System Model Measured Output Predicted Output Input Process Noise Sensor Noise True System State State Est. A mathematical model of the system is assumed known. Same input propagated through true system and model.
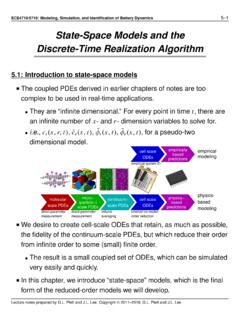
State-Space Models and the Discrete-Time Realization …
mocha-java.uccs.eduDiscrete-Time Realization Algorithm 5.1: Introduction to state-space models The coupled PDEs derived in earlier chapters of notes are too complex to be used in real-time applications. •They are “infinite dimensional.” For every point in time t, there are an infinite number of x- and r- dimension variables to solve for. •i.e., c s(x,r ...
Related documents

ROCK YOUR PLOT • WORKBOOK
rockyourwriting.comROCK YOUR PLOT • WORKBOOK 13 Rock YourWriting.com CHAPTER 4: OVERVIEW OF THE PLOT POINTS The Plot Points After the GMC charts and background character sketches, the next step is figuring out the plot points. They are the guideposts to get you from beginning to the end of your novel. These are the plot points. Space provided is for brief notes:

Systems Analysis and Control
control.asu.eduThe original bode plot The new factor log j1 + G({!) We are most concerned with the e ect of the new term 20logj1 + G({!)j Speci cally, as 1 + G({!) !0 lim 1+G({!)!0 20logj1 + G({!)j= 1 An unstable mode!-80-70-60-50-40-30-20-10 0 10 20 Magnitude (dB) 10-1 10 0 10 1 10 2-180-135-90-45 0 Phase (deg) Bode Diagram Frequency (rad/sec) Figure :Open ...
Experiments with Diffraction - University of Rochester
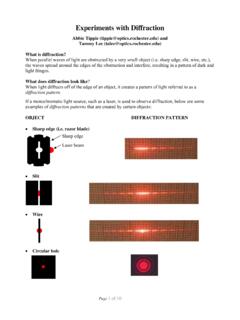
www2.optics.rochester.eduThe intensity looks like the plot below versus position y, where y. z. are the minimums (or zeros): Intensity . y. 1. y. 2. y. 3. Minimums (zeros, y. z) y . Minimums are caused by the destructive interference of plane waves diffracting off the edges of the slit. Destructive interference happens when two plane waves are out of phase to one another.

Elements of Plot - Bainbridge Island School District
www.bisd303.orgElements of Plot, continued Falling Action happens as a result of the climax and we know that the story will soon end. Resolution is when the character solves the main problem/conflict or someone solves it for him or her. Denouement (French: the action of untying): is the series of events that follow the plot's climax.

Quick Summarizing Strategies to Use in the Classroom
www.readingrockets.orgInference Venn Diagram A variation on the above, one side of the Venn has the TEXT information, the other side BACKGROUND INFORMATION, and the “combined,” middle section of the Venn is INFERENCES or conclusions drawn Sequence or Timeline List in order of importance or in chronological order (or steps) the concepts discussed in the lesson

Graphing Linear Equations - St. Francis Preparatory School
www.sfponline.orgWhat are the coordinates of the y-intercept line pictured in the diagram above? : Some of you have worked with slope intercept form of a linear equation before. You may remember: y = mx + b ... To plot to the left side of the y-axis, go to y-int. and do the opposite. (Down 3 …

Scatter Diagrams Correlation Classifications
www.stat.colostate.eduThe Scatter Plot • The scatter diagram for the temperature versus strength data allows us to deduce the nature of the relationship between these two variables 120 130 140 150 160 170 60 50 40 30 20 Scatter diagram of Strength vs Temperature Temperature (F) Strength (psi) What can we conclude simply from the scatter diagram? Chapter 5 # 18

The skew-T log-P diagram - National Weather Service
www.weather.govWhat is a skew-T log-P diagram? •A thermodynamic diagram commonly used in weather analysis and forecasting •pressure plotted on the horizontal axis, with a logarithmic scale (thus the "log-P" part of the name) •temperature plotted skewed, with isothermal lines at 45° to the plot (thus the "skew-T" part of the name)

PD1: Plot Diagram
www1.nyc.govPlot Diagram must show the correct street lines from the City Plan; the plot to be built upon in relation to the street lines and the portion of the lot to be occupied by the building; the legal grades and the existing grades, properly identified, of streets at nearest point from the proposed buildings