
FREQUENCY-RESPONSE ANALYSIS
Plot method #1: Polar plot in complex plane Evaluate G(jω) at each frequency for 0 ≤ ω<∞. Result will be a complex number at each frequency:a + jbor Aejφ. Lecture notes prepared by and copyright ⃝c 1998–2017, Gregory L. Plett and M. Scott Trimboli
Download FREQUENCY-RESPONSE ANALYSIS

Information
Domain:
Source:
Link to this page:
Documents from same domain
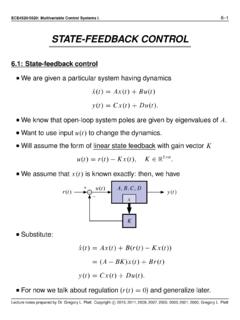
STATE-FEEDBACK CONTROL
mocha-java.uccs.eduECE4520/5520: Multivariable Control Systems I. 6–1 STATE-FEEDBACK CONTROL 6.1: State-feedback control We are given a particular system having dynamics x.t/P D Ax.t/CBu.t/ y.t/D Cx.t/CDu.t/: We know that open-loop system poles are given by eigenvalues of A. Want to use input u.t/ to change the dynamics.

Equivalent-Circuit Cell Models
mocha-java.uccs.edu• Voltage is constant. Period. OCV v(t) i(t) − − + + This model is inadequate, but provides a starting point. • Batteries do supply a voltage to a load. • And, when the cell is unloaded and in complete equilibrium (i.e., “open circuit”), the voltage is fairly predictable. • An ideal voltage source will be part of our equivalent ...

Battery State Estimation
mocha-java.uccs.eduModel-based state estimators implement algorithms that use sensor measurements to infer the internal hidden state of a dynamic system. System Model Measured Output Predicted Output Input Process Noise Sensor Noise True System State State Est. A mathematical model of the system is assumed known. Same input propagated through true system and model.
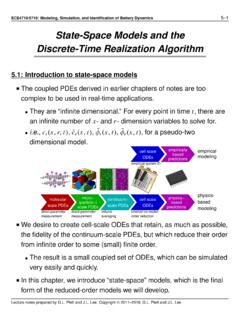
State-Space Models and the Discrete-Time Realization …
mocha-java.uccs.eduDiscrete-Time Realization Algorithm 5.1: Introduction to state-space models The coupled PDEs derived in earlier chapters of notes are too complex to be used in real-time applications. •They are “infinite dimensional.” For every point in time t, there are an infinite number of x- and r- dimension variables to solve for. •i.e., c s(x,r ...
Related documents
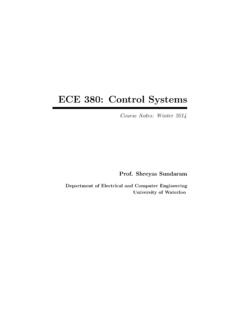
ECE 380: Control Systems - Purdue University College of ...
engineering.purdue.eduParts of these course notes are loosely based on lecture notes by Professors Daniel Liberzon, Sean Meyn, and Mark Spong (University of Illinois), on notes by Professors Daniel Davison and Daniel Miller (University of Waterloo), and on parts of the textbook Feedback Control of Dynamic Systems (5th edition) by Franklin, Powell and Emami-Naeini.

Notes for Signals and Systems - Johns Hopkins University
pages.jh.eduare complex-valued functions of t, or some other real variable, will arise as mathematical conveniences, we will not deal with functions of a complex variable until near the end of the course. 0.3 Analysis Background We will use the notation x[]n for a real or complex-valued sequence (discrete-time signal) defined for integer values of n. This ...
Lectures on Electromagnetic Field Theory
engineering.purdue.eduDec 04, 2019 · Contents Preface xi Acknowledgements xii 1 Introduction, Maxwell’s Equations 1 1.1 Importance of Electromagnetics . . . . . . . . . . . . . . . . . . . . . . . . . . 1
STAT 720 TIME SERIES ANALYSIS
people.stat.sc.eduContents 1 Introduction 1 1.1 Some examples. . . . . . . . . . . . . . . . . . . . . . . . . . . . . . . . . . . . . . . .1 1.2 Time Series Statistical Models ...

Lecture 15 Project Management - University of Washington
faculty.washington.eduI S 460 Lecture Notes Professor Yong Tan Project Management Tools & Techniques A PERT chart is a graphical network model that depicts a project’s tasks and the relationships between those tasks. – Program Evaluation and Review Technique A Gantt chart is a simple horizontal bar chart that depicts project tasks against a calendar. Each bar represents a named project task.
Complex Analysis and Conformal Mapping
www-users.cse.umn.eduThe term “complex analysis” refers to the calculus of complex-valued functions f(z) depending on a single complex variable z. To the novice, it may seem that this subject should merely be a simple reworking of standard real variable theory that you learned in first year calculus. However, this na¨ıve first impression could not be ...
18.03 LECTURE NOTES, SPRING 2014
math.mit.edu18.03 LECTURE NOTES, SPRING 2014 BJORN POONEN 7. Complex numbers Complex numbers are expressions of the form x+ yi, where xand yare real numbers, and iis a new symbol. Multiplication of complex numbers will eventually be de ned so that i2 = 1. (Electrical engineers sometimes write jinstead of i, because they want to reserve i

Introduction to Machine Learning Lecture notes
faculty.ucmerced.eduMiguel A. Carreira-Perpin˜´an at the University of California, Merced. T´ he notes are largely based on the book “Introduction to machine learning” by Ethem Alpaydın (MIT Press, 3rd ed., 2014), with some additions. These notes may be used for educational, non-commercial purposes. c 2015–2016 Miguel A. Carreira-Perpin˜´an´