
Package ‘plot3D’ - R
contour If TRUE, then acontourplot will be added to the image plot, unless x, y are a matrix. Also allowed is to pass a list with arguments for thecontourfunction.
Download Package ‘plot3D’ - R

Information
Domain:
Source:
Link to this page:
Documents from same domain
Package ‘segmented’ - R
cran.r-project.orgPackage ‘segmented’ November 30, 2017 Type Package Title Regression Models with Break-Points / Change-Points Estimation Version 0.5-3.0 Date 2017-11-22
gap: Genetic Analysis Package - R
cran.r-project.org2 gap: Genetic Analysis Package from patients su ering with di erent diseases to identify common genetic variations for each condition. It is hoped that by identifying these genetic signposts, researchers will
Package ‘season’ - R
cran.r-project.orgPackage ‘season’ May 20, 2018 Type Package Title Seasonal Analysis of Health Data Version 0.3.6 Author Adrian Barnett and Peter Baker Maintainer Adrian Barnett <a.barnett@qut.edu.au>
Package ‘medicalrisk’ - The Comprehensive R …
cran.r-project.orgPackage ‘medicalrisk’ ... 2016 Type Package Title Medical Risk and Comorbidity Tools for ICD-9-CM Data Version 1.2 Date 2016-01-23 Description Generates risk estimates and comorbidity flags from ICD-9-CM ... Adapting a clinical comorbidity index for use with ICD-9-CM administrative data: differing perspectives. Journal of clinical ...
Package ‘testthat’ - R
cran.r-project.orgPackage ‘testthat’ December 13, 2017 Title Unit Testing for R Version 2.0.0 Description Software testing is important, but, in part because it is
Package ‘forecast’ - The Comprehensive R Archive …
cran.r-project.orgPackage ‘forecast’ June 21, 2018 Version 8.4 Title Forecasting Functions for Time Series and Linear Models Description Methods and tools for displaying and analysing
Package ‘emma’ - R
cran.r-project.org2 emma-package Index 21 emma-package Designing experiments for process optimization Description The evolutionary model-based multiresponse approach (EMMA) is a procedure for process opti-
Package ‘WeibullR’ - cran.r-project.org
cran.r-project.orgPower" presentations in Appendix D of "The New Weibull Handbook, Fifth Edition". For validity of a 3rd parameter optimization on a given model over its 2 parameter fit, only the Likelihood Ratio Test will be applied. This validity check requires an LRT-P greater than 50 Value
Package ‘maps’ - R
cran.r-project.orgPackage ‘maps’ April 3, 2018 Title Draw Geographical Maps Version 3.3.0 Date 2018-04-03 Author Original S code by Richard A. Becker and Allan R. Wilks.
Package ‘psycho’ - The Comprehensive R Archive Network
cran.r-project.orgPackage ‘psycho’ September 13, 2018 Type Package Title Efficient and Publishing-Oriented Workflow for Psychological Science Version 0.3.7 Maintainer Dominique Makowski <dom.makowski@gmail.com>
Related documents
Basic Graphics in R - Harvard University
bcb.dfci.harvard.eduPlot of data.frame elements If the rst argument to plot() is a data.frame, this can be as simply as plot(x,y) providing 2 columns (variables in the data.frame). Lets look at the data in the data.frame airquality which measured the 6 air quality in New
LabVIEW Lesson 6 – File I/O and Plotting
boson.physics.sc.eduLabVIEW Lesson 6 – File I/O and Plotting Lesson Overview • Why use file I/O? ... File I/O formats depend on the type of files being used. 3 types of formats exist: text, binary, and datalog. ... the plot lines, the type of data points (useful when plotting multiple sets of data), and many other options. ...

Using SAS’s PROC GPLOT to plot data and lines
cob.jmu.eduUsing SAS’s PROC GPLOT to plot data and lines PROC GPLOT creates “publication quality” color graphics which can easily be exported into documents, presentations, etc. To export the graphs for future use click on file, export. In the dialog box choose a

Basic Plotting with Python and Matplotlib
courses.csail.mit.eduThe basic syntax for creating line plots is plt.plot(x,y), where x and y are arrays of the same length that specify the (x;y) pairs that form the line. For example, let’s plot the cosine function from 2 to 1.

PLOTTING AND GRAPHICS OPTIONS IN MATHEMATICA
dslavsk.sites.luc.eduPLOTTING AND GRAPHICS OPTIONS IN MATHEMATICA In addition to being a powerful programming tool, Mathematica allows a wide array of plotting and graphing options. We will look at a variety of these, starting with the Plot command. ... Plot x, x^2, x^3, x ...

Unit 9 Describing Relationships in Scatter Plots and Line ...
lycofs01.lycoming.edu56 Unit 9 Describing Relationships in Scatter Plots and Line Graphs Objectives: • To construct and interpret a scatter plot or line graph for two quantitative variables
Math 141 - Quantile-Quantile Plots
people.reed.eduThe QQ plot The quantile–quantile plot, or QQplot, is a simple graphical method for comparing two sets of sample quantiles. Plot the pairs of order statistics (X (k);Y (k)): If the two datasets come from the same distribution, the points ... Math 141 - Quantile-Quantile Plots ...

Plotting functions of more than one variable with Mathematica
physics.weber.eduPlotting functions of more than one variable with Mathematica Physics 3510, Weber State University This tutorial assumes that you are already somewhat familiar with Mathematica.

Split Plots - Statistics
users.stat.umn.eduAll split plots in the same whole plot get the same level of the whole plot treatment factor. All levels of the split plot treatment factor occur in each whole plot. The restricted randomization is equivalent to the two randomizations of the unit structure approach.
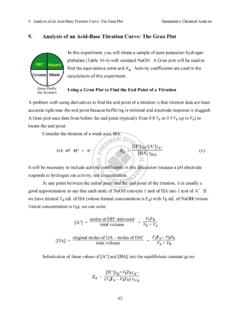
9. Analysis of an Acid-Base Titration Curve: The Gran Plot
web.mnstate.eduThe Gran plot in the acidic region gives accurate results even if there is CO2 dissolved in the strong base titrant. The Gran plot in the basic region can be used to measure CO2 in the strong base. For completeness, we note that if weak base, B, is titrated with a strong acid, the Gran
Related search queries
Basic Graphics in R, Plot, Lesson 6, File I/O, The Plot, Using SAS’s PROC GPLOT to plot data, Basic Plotting with Python and Matplotlib, PLOTTING AND GRAPHICS OPTIONS IN, Describing Relationships in Scatter Plots, Math 141 - Quantile-Quantile Plots, Plotting functions of more than one variable with Mathematica, Split plots, Gran plot