Transcription of Math 141 - Quantile-Quantile Plots
1 math 141 Quantile-Quantile PlotsAlbyn Jones11 Library jones/courses/141 Albyn JonesMath 141 Outline: Quantile-Quantile PlotsQuantiles and Order StatisticsQuantile- quantile PlotsNormal quantile PlotsAlbyn JonesMath 141 Quantiles and Order StatisticsDefinition: p-th quantileqpEarlier we defined the p-th quantile of the distribution of a RVXas any numberqpsatisfyingP(X qp) pandP(X qp) (1 p).Albyn JonesMath 141 Order StatisticsSample quantiles are based onOrder Statistics:LetX1,X2,..,Xnbe a sample of sizen. Theorder statisticsX(1),X(2),..,X(n)are just the observations sorted intoascending order.# The data> x[1] 76 92 83 105 102 109 106 91 110 89# The order statistics> sort(x)[1] 76 83 89 91 92 102 105 106 109 110 Albyn JonesMath 141 Order Statistics and Sample QuantilesThere are numerous definitions of sample quantiles chosen toperform well under various conditions.
2 All involve interpolationbetween neighboring order that we want thepth quantile , wherepliesbetweenk/nand(k+1)/n. There are variations, but allare, for some choice ofa [0,1]: qp=aX(k)+ (1 a)X(k+1)Example, whennis even, the sample usuallytaken to be the average of the two middle JonesMath 141 Order Statistics and Sample QuantilesThere are numerous definitions of sample quantiles chosen toperform well under various conditions. All involve interpolationbetween neighboring order that we want thepth quantile , wherepliesbetweenk/nand(k+1)/n. There are variations, but allare, for some choice ofa [0,1]: qp=aX(k)+ (1 a)X(k+1)Example, whennis even, the sample usuallytaken to be the average of the two middle JonesMath 141 Order Statistics and Sample QuantilesThere are numerous definitions of sample quantiles chosen toperform well under various conditions.
3 All involve interpolationbetween neighboring order that we want thepth quantile , wherepliesbetweenk/nand(k+1)/n. There are variations, but allare, for some choice ofa [0,1]: qp=aX(k)+ (1 a)X(k+1)Example, whennis even, the sample usuallytaken to be the average of the two middle JonesMath 141 Order Statistics as Sample QuantilesLet s turn it around, and ask what sample quantiles correspondto the order statistics?Consider 4 observations from a population. On the average, weexpect them to at least approximately divide the population intoequal chunks corresponding to equally spaced percentiles:15,25,35,45In other words, they correspond to the sample , , , JonesMath 141 Comparing Two SamplesSuppose we have two samples of sizen,X1,X2.
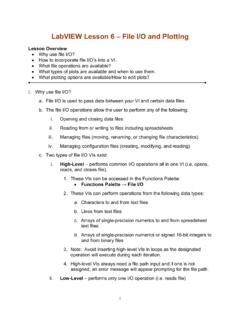
4 XnandY1,Y2,.. they were samples from the same distribution, then theorder statisticsX(1),X(2),..X(n)andY(1),Y(2),. .Y(n)would be estimates of the same we expect thatX(1) Y(1),X(2) Y(2), JonesMath 141 Comparing Two SamplesSuppose we have two samples of sizen,X1,X2,..XnandY1,Y2,.. they were samples from the same distribution, then theorder statisticsX(1),X(2),..X(n)andY(1),Y(2),. .Y(n)would be estimates of the same we expect thatX(1) Y(1),X(2) Y(2), JonesMath 141 Comparing Two SamplesSuppose we have two samples of sizen,X1,X2,..XnandY1,Y2,.. they were samples from the same distribution, then theorder statisticsX(1),X(2),..X(n)andY(1),Y(2),. .Y(n)would be estimates of the same we expect thatX(1) Y(1),X(2) Y(2), JonesMath 141 The QQ plotThe quantile quantile plot , or QQplot, is a simple graphicalmethod for comparing two sets of sample quantiles.
5 plot thepairs of order statistics(X(k),Y(k)).If the two datasets come from the same distribution, the pointsshould lie roughly on a line through the origin with slope JonesMath 141QQ plot examplelllllllllllllllllllllllllllllllll llllllllllllllllllllllllllllllllllllllll llllllllllllllllllllllllllllllllllllllll llllllllllllllllllllllllllllllllllllllll llllllllllllllllllllllllllllllllllllllll lllllll 3 2 1012 3 2 10123 XYQQ plot of two N(0,1) samples of size 200 Albyn JonesMath 141QQ plot example, small sample!Alert!!With small samples, expect variation!llllllllllllllllllll 3 2 101 of two N(0,1) samples of size 20 Albyn JonesMath 141QQ plot example: location shiftTwo samples from similar distributions which differ only inlocation: the green reference line isy= 2 10120123456 XYQQ plot of two samples of size 200 Albyn JonesMath 141QQ plot example: different spreadTwo samples from similar distributions which differ only inspread, with reference 2 1012 6 4 20246 XYQQ plot of two samples of size 200 Albyn JonesMath 141QQ plot example: different shapeTwo samples from distributions which differ in shape, as well aslocation and spread, with reference 2 10123 XYQQ plot of two samples of size 200 Albyn JonesMath 141QQ plot example.
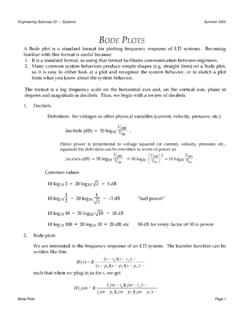
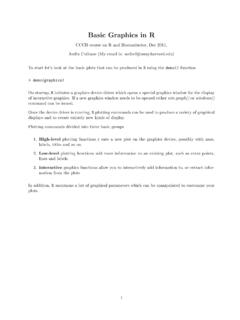
6 Anorexia dataThe Family Therapy group had 17 subjects, the Control Therapy26. qqplot() uses estimated quantiles for the larger 10 5051015 505101520 ControlFamilyQQplot of Family Therapy vs ControlAlbyn JonesMath 141 Normal quantile PlotsOften we wish to compare a dataset to the Normal distribution,a theoretical population, rather than to a second function that Plots the order statistics of a sample against thecorresponding quaintiles of the standard normal distribution:qqnorm(X)If the plot is roughly linear, then our data are approximatelynormally JonesMath 141 Normal quantile plot : Normal dataDon t expect a perfectly straight plot even with normal data!lllllllllllllllllllllllllllllllllll lllllllllllllll 2 101205101520 Normal Q Q PlotTheoretical QuantilesSample QuantilesAlbyn JonesMath 141 Normal quantile plot : Mean and SDWe can estimate the mean and SD from a Normal quantile plot :the mean is roughly equal to the median (plotted above 0), andthe slope is roughly the 2 101205101520 Normal Q Q PlotTheoretical QuantilesSample Quantilesrise: JonesMath 141 Normal quantile plot : Short Tailslllllllllllllllllllllllllllllllllll lllllllllllllll 2 1012 50510152025 Normal Q Q PlotTheoretical QuantilesSample QuantilesAlbyn JonesMath 141 Normal quantile plot : Short TailsShort tails are hard to diagnose from a density plot !
7 TailsN = 50 Bandwidth = JonesMath 141 Normal quantile plot : Long Tailslllllllllllllllllllllllllllllllllll lllllllllllllll 2 1012 2 1012 Normal Q Q PlotTheoretical QuantilesSample QuantilesAlbyn JonesMath 141 Density plot : Long Tails TailsN = 50 Bandwidth = JonesMath 141 Normal quantile plot : Positive Skewnessllllllllllllllllllllllllllllllll llllllllllllllllll 2 1012024681012 Normal Q Q PlotTheoretical QuantilesSample QuantilesAlbyn JonesMath 141 Density plot : Positive SkewnessN = 50 Bandwidth = JonesMath 141 Normal quantile plot : Negative Skewnessllllllllllllllllllllllllllllllll llllllllllllllllll 2 101268101214 Normal Q Q PlotTheoretical QuantilesSample QuantilesAlbyn JonesMath 141 Normal quantile plot : Bimodal Datallllllllllllllllllllllllllllllllllll llllllllllllll 2 101224681012 Normal Q Q PlotTheoretical QuantilesSample QuantilesAlbyn JonesMath 141 Density plot : Bimodal dataN = 50 Bandwidth = JonesMath 141 Other distributionsSuppose we would like to make a theoretical quantile plot for adatasetXto compare to some other distribution, say aChisquared distribution with 5 degrees of freedom.
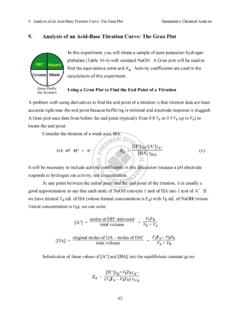
8 Easy:Sort your dataset:SampleQuantiles <- sort(X)Compute the theoretical quantiles:ChiSqQuantiles <- qchisq(ppoints(X),5) plot : plot (ChiSqQuant iles,SampleQuantiles,pch=19)Albyn JonesMath 141 Other distributionsSuppose we would like to make a theoretical quantile plot for adatasetXto compare to some other distribution, say aChisquared distribution with 5 degrees of freedom. Easy:Sort your dataset:SampleQuantiles <- sort(X)Compute the theoretical quantiles:ChiSqQuantiles <- qchisq(ppoints(X),5) plot : plot (ChiSqQuant iles,SampleQuantiles,pch=19)Albyn JonesMath 141 Other distributionsSuppose we would like to make a theoretical quantile plot for adatasetXto compare to some other distribution, say aChisquared distribution with 5 degrees of freedom.
9 Easy:Sort your dataset:SampleQuantiles <- sort(X)Compute the theoretical quantiles:ChiSqQuantiles <- qchisq(ppoints(X),5) plot : plot (ChiSqQuant iles,SampleQuantiles,pch=19)Albyn JonesMath 141 Other distributionsSuppose we would like to make a theoretical quantile plot for adatasetXto compare to some other distribution, say aChisquared distribution with 5 degrees of freedom. Easy:Sort your dataset:SampleQuantiles <- sort(X)Compute the theoretical quantiles:ChiSqQuantiles <- qchisq(ppoints(X),5) plot : plot (ChiSqQuant iles,SampleQuantiles,pch=19)Albyn JonesMath 141 Gamma quantile Plotlllllllllllllllllllllllll24681024681 0 Gqsort(X)Gamma quantile PlotAlbyn JonesMath 141 SummaryQQplots are an excellent graphical tool for comparing twosamples to each other, or one sample to a theoreticaldistribution like the Normal.
10 They reveal differences in location,spread and shape more clearly than do density Plots JonesMath 141