Transcription of LabVIEW Lesson 6 – File I/O and Plotting
1 1 LabVIEW Lesson 6 File I/O and Plotting Lesson Overview Why use file I/O? How to incorporate file I/O s into a VI. What file operations are available? What types of plots are available and when to use them. What Plotting options are available/How to edit plots? I. Why use file I/O? a. File I/O is used to pass data between your VI and certain data files. b. The file I/O operations allow the user to perform any of the following: i. Opening and closing data files ii. Reading from or writing to files including spreadsheets iii. Managing files (moving, renaming, or changing file characteristics) iv.
2 Managing configuration files (creating, modifying, and reading) c. Two types of file I/O VIs exist: i. High-Level performs common I/O operations all in one VI ( opens, reads, and closes file). 1. These VIs can be accessed in the Functions Palette: Functions Palette File I/O 2. These VIs can perform operations from the following data types: a. Characters to and from text files b. Lines from text files c. Arrays of single-precision numerics to and from spreadsheet text files d. Arrays of single-precision numerics or signed 16-bit integers to and from binary files 3.
3 Note: Avoid inserting high-level VIs in loops as the designated operation will execute during each iteration. 4. High-level VIs always need a file path input and if one is not assigned, an error message will appear prompting for the file path. ii. Low-Level performs only one I/O operation ( reads file) 2 d. File I/O formats depend on the type of files being used. 3 types of formats exist: text, binary, and datalog. Some basic guidelines for choosing a data type are: i. Text files are the most common and should be used if the data will be used in programs such as Word and Excel. ii. Binary files are more efficient than text files with respect to disk space and speed and should be used if memory and speed is crucial.
4 Iii. Datalog files are the best way to store data if the data will only be accessed in LabVIEW and if the data structure is complex. II. How to incorporate file I/O s into a VI. a. Access File I/O operations by: Functions Palette All-Functions File I/O b. In addition to the File I/O operations, the user will need to identify the File Path so that the VI knows where the file can be accessed. Insert a File Path Control or Indicator by: Controls Palette All-Controls String & Path File Path Control or File Path Indicator c. Example : Modifying the to Incorporate File I/O i.
5 PROBLEM: The user is measuring the temperature of a cup of hot water (100 deg F) as it is left to cool in 20 deg F air, probably in a refrigerator. In addition to the experimental temperature, the user has created a file with the theoretical temperatures from time 0 to 100 seconds and would like to compare these values to the experimental values while the experiment is executing. Lastly, the user would like to create a file that stores all the temperature measurement values so that he/she may load them into Excel or another spreadsheet to analyze the data further. ii. This example will modify the previously created temperature reading VI to allow the user to access a file with the theoretical temperature values and compare them to the experimental temperature values.
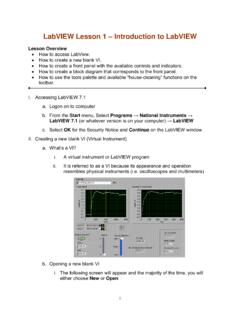
6 Once the measurements are complete, the VI will then append the experimental temperature values to a copy of the accessed file. iii. Open and go to the Front Panel. 1. Insert 2 File Path Controls, one will be used to identify the file that contains the theoretical temperature data and the other will identify the temperature file which the experimental temperature data will be appended, so name them appropriately. 3 Controls Palette All-Controls String & Path File Path Control 2. Insert 2 File Path Indicators; these will indicate the file that is actually being retrieved by the File I/O operations, so name them appropriately.
7 Controls Palette All-Controls String & Path File Path Indicator 3. Insert 2 additional Numerical Indicators, so the VI can display the theoretical temperature as well as the temperature difference between the experimental and theoretical temperatures. Again, name them accordingly. 4. Expand the Top-Right Box on the Waveform Chart so that it includes two plots. This will serve as the legend for the experimental and theoretical temperature plots, so name the two accordingly. Note: The names should follow the same order as data will be connected in a Bundle Function. 5. Arrange the Front Panel in some logical orientation.
8 Refer to Figure for some guidance, if necessary. Figure : Front Panel Configuration for Modified Temperature VI iv. Switch to the Block Diagram. 1. Setup the Theoretical Temperature Reading File Input. 4 a. Insert Read Characters from File SubVI inside the For Loop; this will read in the theoretical temperature one value at a time. Functions Palette All-Functions File I/O Read Characters from File b. Add a Set of Shift Registers, which will keep track of the character position in the file. (The SubVI will read a certain length of characters and after it reads those characters, the shift registers will store the placement and the SubVI will start reading from that position in the next iteration.)
9 C. Create a Numerical Constant connected to the Left Shift Register and input the value of 295. (This indicates where the reading will start; it will skip the first 295 characters, which is the time data.) d. Wire the Left Shift Register to the Start of Read Offset Terminal (Bottom Terminal on Left Side). e. Wire the Mark after Read Terminal (Bottom Terminal on Right Side) to the Right Shift Register. f. Create a Numerical Constant connected to the Number of Characters Terminal (Middle Terminal on Left Side) and input the value of 7 (This tells the SubVI to read 7 characters per iteration, since each temperature value contains 6 numbers and a decimal.)
10 G. Connect the Theoretical Temp File Path Control to the File Path Terminal (Top Terminal on Left Side) and the Theoretical Temp File Path Indicator to the New File Path Terminal (Top Terminal on Right Side). h. Insert a Fract/Exp String to Number Function and wire the File Read Function s Character String Terminal to String Terminal of this function, since the output of the SubVI is a String of Characters and it needs to be in a numeric format, this function will do the needed conversion. 2. Setup Waveform Chart to plot Both Sets of Data a. Insert a Bundle Function that will collect both sets of data into one cluster which can be connected to the Waveform Chart.