
Process Capability Analysis Using MINITAB (I)
From the Normal probability plot graph in Figure 2, the Anderson-Darling (A-D) Normality test shows that we are unable to reject the null hypothesis, H
Download Process Capability Analysis Using MINITAB (I)

Information
Domain:
Source:
Link to this page:
Documents from same domain

Statistical Inference and t-Tests - Minitab
www.minitab.comStatistical Inference and t-Tests - Minitab ... Test

Analysis of Variance (ANOVA) Using Minitab
www.minitab.comAnalysis of Variance (ANOVA) Using Minitab By Keith M. Bower, M.S., Technical Training Specialist, Minitab Inc. Frequently, scientists are concerned with detecting differences in means (averages)

Learn how Minitab can help you
www.minitab.com3.4 2 Variances Test 3.4.1 Basic Concepts 3.4.2 Boxplots 3.4.3 2 Variances Test Results 3.4.4 Assumptions 3.4.5 Quiz: 2 Variances Test 3.4.6 Minitab Tools: 2 Variances Test

When To Use Fisher’s Exact Test - Minitab
www.minitab.comFisher’s exact test considers all the possible cell combinations that would still result in the marginal frequencies as highlighted (namely 9, 9 and 12, 6).

GettingStartedwithMinitab17
www.minitab.comTheMinitabuserinterface Beforeyoustartyouranalysis,openMinitabandexaminetheMinitabuserinterface.FromtheWindowstaskbar,choose Start>AllPrograms>Minitab ...

InstallationGuide - Minitab
www.minitab.comMinitab®,Quality.Analysis.Results.®andtheMinitablogoareregisteredtrademarksofMinitab,Inc.,intheUnited Statesandothercountries.AdditionaltrademarksofMinitab,Inc ...

Practical Applications for Applying Six Sigma Using …
www.minitab.comTitle: Basic Quality Tools Author: Peter Peterka Created Date: 10/3/2016 12:19:58 PM

C = 0
www.minitab.com© 2014 Minitab, Inc. Developing Acceptance Sampling Plans We will generate two plans AQL (Acceptable Quality Level) of 1.5% RQL (Rejectable Quality Level) of 7.5% and also at 11.5%
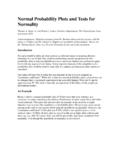
Normal Probability Plots and Tests for Normality
www.minitab.comNormal Probability Plots and Tests for Normality Thomas A. Ryan, Jr. and Brian L. Joiner, Statistics Department, The Pennsylvania State University 1976

Evaluación de la variación de un sistema de medición
www.minitab.comEvaluación de la variación de un sistema de medición Estudios del sistema de medición para datos
Related documents
Introduction to CONTINUOUS QUALITY …
www.statit.comSTATIT QUALITY CONTROL FIRST AID KIT 4 details of these rules are provided in Appendix 1: AT&T’s Statistical Quality Control Standards on page 35.
I Sixth Edition ntroduction to - dl4a.org
dl4a.orgPreface Introduction This book is about the use of modern statistical methods for quality control and improvement. It provides comprehensive coverage of the subject from basic principles to state-of-the-art concepts
Statistical Process Control (SPC) - GHSP
www.ghsp.comwww.ghsp.com A JSJ Business Statistical Process Control (SPC) Training Guide Rev X05, 09/2013
Introduction to STATISTICAL PROCESS CONTROL …
www.statit.comSTATIT CUSTOM QC OVERVIEW iii Preface 1 Quality Control Today 1 New Demands On Systems Require Action 1 Socratic SPC -- Overview Q&A 2 Steps Involved In Using Statistical Process Control 6
Process Control and Optimization - Free
twanclik.free.frProcess Control and Optimization Béla G. Lipták EDITOR-IN-CHIEF INSTRUMENT ENGINEERS’ HANDBOOK Fourth Edition A CRC title, part of the Taylor & Francis imprint, a member of the
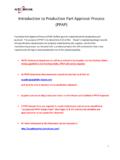
Introduction to Production Part Approval Process …
supplierportal.alto-shaam.com1 Introduction to Production Part Approval Process (PPAP) Production Part Approval Process (PPAP) defines generic requirements for production part
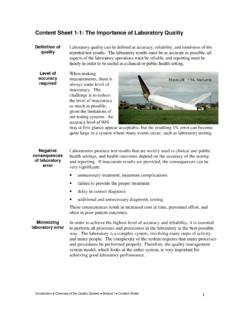
Content Sheet 1-1: The Importance of Laboratory …
www.who.intIntroduction Overview of the Quality System Module 1 Content Sheet 1 Content Sheet 1-1: The Importance of Laboratory Quality Definition of

Control And Its Process - ICSI
www.icsi.eduIntroduction Controlling is an important function of management. It is the process that measures current performance and guides it towards some predetermined objectives The modern concept of control envisages a system that not only provides a historical record of what has happened to

Process Capability Analysis and Process Analytical …
www.statisticaloutsourcingservices.comShort-Term • Statistical Process Control methods such as control charting provide estimates for short term variability. • Short term variability is defined as …
Related search queries
Introduction, CONTINUOUS QUALITY, Control, Statistical, Statistical Process Control SPC, Introduction to STATISTICAL PROCESS CONTROL, Statistical Process Control, Process Control and Optimization, Production Part Approval Process, 1: The Importance of Laboratory, 1: The Importance of Laboratory Quality, Control And Its Process, Process, Process Capability