
Process Capability Analysis Using MINITAB (I)
From the Normal probability plot graph in Figure 2, the Anderson-Darling (A-D) Normality test shows that we are unable to reject the null hypothesis, H
Download Process Capability Analysis Using MINITAB (I)

Information
Domain:
Source:
Link to this page:
Documents from same domain

Statistical Inference and t-Tests - Minitab
www.minitab.comStatistical Inference and t-Tests - Minitab ... Test

Analysis of Variance (ANOVA) Using Minitab
www.minitab.comAnalysis of Variance (ANOVA) Using Minitab By Keith M. Bower, M.S., Technical Training Specialist, Minitab Inc. Frequently, scientists are concerned with detecting differences in means (averages)

Learn how Minitab can help you
www.minitab.com3.4 2 Variances Test 3.4.1 Basic Concepts 3.4.2 Boxplots 3.4.3 2 Variances Test Results 3.4.4 Assumptions 3.4.5 Quiz: 2 Variances Test 3.4.6 Minitab Tools: 2 Variances Test

When To Use Fisher’s Exact Test - Minitab
www.minitab.comFisher’s exact test considers all the possible cell combinations that would still result in the marginal frequencies as highlighted (namely 9, 9 and 12, 6).
Process Capability Analysis Using MINITAB (I)
www.minitab.comConclusion Capability analyses are frequently reported as part of an ongoing quality program though, in many instances, statistics are merely reported and an …

GettingStartedwithMinitab17
www.minitab.comTheMinitabuserinterface Beforeyoustartyouranalysis,openMinitabandexaminetheMinitabuserinterface.FromtheWindowstaskbar,choose Start>AllPrograms>Minitab ...

InstallationGuide - Minitab
www.minitab.comMinitab®,Quality.Analysis.Results.®andtheMinitablogoareregisteredtrademarksofMinitab,Inc.,intheUnited Statesandothercountries.AdditionaltrademarksofMinitab,Inc ...

Practical Applications for Applying Six Sigma Using …
www.minitab.comTitle: Basic Quality Tools Author: Peter Peterka Created Date: 10/3/2016 12:19:58 PM

C = 0
www.minitab.com© 2014 Minitab, Inc. Developing Acceptance Sampling Plans We will generate two plans AQL (Acceptable Quality Level) of 1.5% RQL (Rejectable Quality Level) of 7.5% and also at 11.5%
Normal Probability Plots and Tests for Normality
www.minitab.comNormal Probability Plots and Tests for Normality Thomas A. Ryan, Jr. and Brian L. Joiner, Statistics Department, The Pennsylvania State University 1976
Related documents
Managing Turnarounds: Phases and Actions in the …
www.strategicmgtpartners.comCollard - Page 3 of 7 Turnaround Phases & Actions: Stages in the Turnaround Process There are five stages in the turnaround process: Management Change, Situation Analysis,
PFMEA Process Failure Mode and Effects Analysis
www.asq0511.orgz. Process Flow Diagram is the . foundation The process must be defined step by step, including interfaces The PFD provides the structure to document what product
VERB TENSE FOR ANALYSIS OF LITERATURE AND …
gato-docs.its.txstate.edu1 VERB TENSE FOR ANALYSIS OF LITERATURE AND HISTORY . Writing about literature . 1. Whether you are dealing with fiction, …

Process Capability Analysis Using MINITAB (II)
www.minitab.comProcess Capability Analysis Using MINITAB (II) By Keith M. Bower, M.S. Abstract This paper builds on the content covered in the previous edition of EXTRAOrdinary
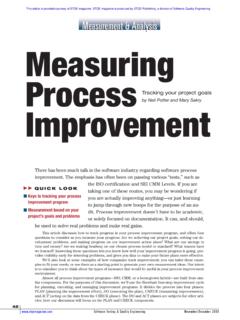
Measurement & Analysis Measuring Process
www.tarrani.netgoal (from the list above). The first column lays out the primary and intermediate goals of the improvement project, deriving the intermediate goals …

www.mtain.com Logistics Support Analysis Process
www.mtain.comwww.mtain.com Copyright © - 2001-2011: MTain Except where otherwise noted. All rights reserved. Reproduction in whole or in part without permission is prohibited

Process Capability Analysis
www.milanor.netQuality and Quality Management 1 Quality and Quality Management 2 Process Capability Analysis 3 Process Capability Analysis for Normal Distributions 4 Process Capability Analysis for Non-Normal Distributions Process Capability Analysis 3 / 68 Quality and Quality Management De nitions and Implications? ISO 9000 is a family of …
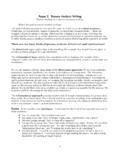
Paper 2: Process Analysis Writing - PCC
spot.pcc.edu1 Paper 2: Process Analysis Writing Process analysis is a type of expository writing. What's the goal of process analysis writing? The goal of all process analysis writing is the same: to teach the reader about a process. Cookbooks, car repair books, computer manuals, sewing books, business books … these are
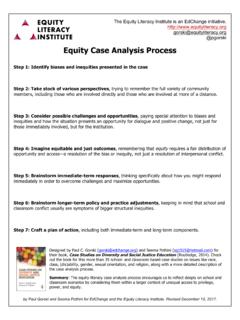
Equity Case Analysis Process - EdChange
www.edchange.orgThe Equity Literacy Institute is an EdChange initiative. http://www.equityliteracy.org gorski@equityliteracy.org @pgorski by Paul Gorski and Seema Pothini for ...
Related search queries
Managing Turnarounds: Phases and Actions, Process, Analysis, Process Failure Mode and Effects Analysis, TENSE FOR ANALYSIS OF LITERATURE AND, TENSE FOR ANALYSIS OF LITERATURE AND HISTORY, Process Capability Analysis, Analysis Measuring Process, Logistics Support Analysis Process, Process analysis, Analysis Process, Equity Literacy, Equityliteracy