Syntax - Stata
The relative merits of the skewness and kurtosis test versus the Shapiro–Wilk and Shapiro–Francia tests have been a subject of debate. The interested reader is directed to the articles in the Stata Technical Bulletin. Our recommendation is to use the Shapiro–Francia test whenever possible, that is, whenever
Download Syntax - Stata

Information
Domain:
Source:
Link to this page:
Documents from same domain

Syntax - Stata
www.stata.com2cluster kmeans and kmedians— Kmeans and kmedians cluster analysis Options Main k(#) is required and indicates that # groups are to be formed by the cluster analysis.

Syntax Description - Stata
www.stata.com2substr()— Extract substring Diagnostics In substr(s, b, l) and substr(s, b), if b describes a position before the beginning of the string or after the end, "" is returned.

Title stata.com generate — Create or change …
www.stata.comTitle stata.com generate — Create or change contents of variable SyntaxMenuDescriptionOptions Remarks and examplesMethods and formulasReferencesAlso see Syntax Create new variable generate type newvar

SyntaxDescriptionRemarks and examplesAlso see
www.stata.commacro— Macro definition and manipulation 3 Macro extended functions related to matrices rownamesjcolnamesjrowfullnamesjcolfullnames matname roweqjcoleq

Title stata.com graph box — Box plots
www.stata.comgraph box— Box plots 3 Menu Graphics > Box plot Syntax graph box yvars if in weight, options graph hbox yvars if in weight, options where yvars is a varlist options Description

Title stata
www.stata.comarea options — Options for specifying the look of special areas 3 Also see [G-2] graph dot — Dot charts (summary statistics)

www.stata.com
www.stata.com2cluster dendrogram— Dendrograms for hierarchical cluster analysis The height of the vertical lines and the range of the (dis)similarity axis give visual clues about the

Title stata.com putexcel — Export results to an Excel …
www.stata.computexcel— Export results to an Excel file 3 export options Description Main overwritefmt overwrite existing cell formatting when exporting new content

destring — Convert string variables to numeric ... - …
www.stata.comTitle stata.com destring — Convert string variables to numeric variables and vice versa SyntaxMenuDescription Options for destringOptions for tostringRemarks and …

Title stata.com gettoken — Low-level parsing
www.stata.comTitle stata.com gettoken — Low-level parsing SyntaxDescriptionOptionsRemarks and examplesAlso see Syntax gettoken emname1 emname2: emname3, parse("pchars") quotes qed(lmacname) match(lmacname) bind
Related documents

Statistical Analysis Handbook - StatsRef
www.statsref.com12.1.5 Shapiro-Wilk 405 12.1.6 Jarque-Bera 407 12.1.7 Lilliefors 408 12.2 Z-tests 409 12.2.1 Test of a single mean, standard deviation known 409 12.2.2 Test of the difference between two means, standard deviations known 411 12.2.3 Tests for proportions, p 412 12.3 T-tests 414 12.3.1 Test of a single mean, standard deviation not known 414
Repeated measures (within-subjects) ANOVA
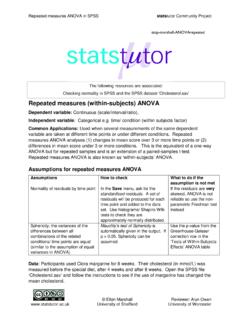
www.sheffield.ac.ukset. Use histograms/ Shapiro-Wilk tests to check they are approximately normally distributed. If the residuals are very skewed, ANOVA is not reliable so use the non-parametric Friedman test instead Sphericity: the variances of the differences between all combinations of the related conditions/ time points are equal (similar to the assumption of ...

Understanding the Independent t Test
oak.ucc.nau.eduKolmogorov-Smirnova Shapiro-Wilk a. Lilliefors Significance Correction For the above example, where a = .001, given that p = .170 for the Low Stress Group and p = .062 for the High Stress Group – we would conclude that each of the levels of the Independent Variable (Stress Condition) are normally distributed. Therefore, the assumption
PERBEDAAN MODEL PEMBELAJARAN PROBLEM BASED …
eprints.ums.ac.idSmirnov(a) Shapiro-Wilk Statistic df Sig. Statistic df Sig. Hasil belajar PBL ,163 32 ,031 ,930 32 ,040 PP ,193 32,004 ,936 ,059 kontrol ,180 32 ,010 ,892 32 ,004 Berdasakan tabel 2 hasil uji normalitas dari nilai post-test menurut Kolmogorov-Smirnov didapatkan nilai signifikansi yang
Qual o teste de hipótese a ser usado nas suas análises ...
www.inf.ufsc.brSHAPIRO-WILK POR SIMULAÇÃO. (arquivo denominado Testes_aderencia.pdf) Comparação de testes paramétricos e testes não paramétricos . Teste de Wilcoxon para duas amostras dependentes O teste de Wilcoxon exige a seguinte suposição: ao utilizar o teste para duas