
Using Excel, Chapter 8: Hypothesis Testing - One Sample
Using Excel, Chapter 8: Hypothesis Testing - One Sample Excel alone does not conduct complete hypothesis tests1. However, once you calculate the test statistic, Excel can get the critical values and the P-values needed to complete the test. The functions used to get critical values and P-values are demonstrated here.
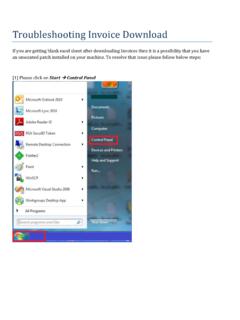
Download Using Excel, Chapter 8: Hypothesis Testing - One Sample

Information
Domain:
Source:
Link to this page:
Documents from same domain
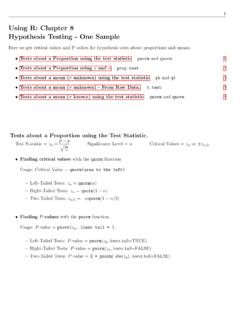
Using R: Chapter 8 Hypothesis Testing - One Sample
cosmosweb.champlain.eduUsing R: Chapter 8 Hypothesis Testing - One Sample Here we get critical values and P-values for hypothesis tests about proportions and means. Tests about a Proportion using the test statistic pnorm and qnorm. 1 Tests about a Proportion using xand n prop.test 2 Tests about a mean (˙unknown) using the test statistic pt and qt 3

Using SPSS, Chapter 8: Hypothesis Testing - One Sample
cosmosweb.champlain.eduChapter 8.3 - Hypothesis Tests About a Mean: ˙Not Known 1.Open or create your data. It must be in the form of rows=cases and columns=variables. SPSS can not be used with only the summarizing statistics (mean, standard deviation, sample size). Below left is the sample data. The sample mean is 38.6 and the sample standard deviation is 8.5. 2.

Using SPSS, Chapter 9: Hypothesis Testing - Two Samples
cosmosweb.champlain.eduChapter 9.2 - Hypothesis Tests for Two Means: Independent Data 4 SPSS does this really well but you do need the raw data1. Click here for online calculators that work well with summary statistics. Chapter 9.3 - Hypothesis Tests for Two Proportions 6 SPSS doesn’t do this the same way it is done in the book.

Using R: Frequency Distributions, Histograms, Scatterplots ...
cosmosweb.champlain.eduThen we created a relative and cumulative frequency table from this. Frequency Distribution: Males Scores Frequency 30 - 39 1 40 - 49 3 50 - 59 5 60 - 69 9 70 - 79 6 80 - 89 10 90 - 99 8 Relative Frequency Distribution: Males Relative Scores 30 - 39 2.4% 40 - 49 7.1% 50 - 59 11.9% 60 - 69 21.4% 70 - 79 14.3% 80 - 89 23.8% 90 - 99 19.0% ...

Using R, Chapter 6: Normal Distributions pnorm and …
cosmosweb.champlain.edu1 Using R, Chapter 6: Normal Distributions The pnorm and qnorm functions. Getting probabilities from a normal distribution with mean and standard deviation ˙

Using the TI-83/84 Plus Chapter 8: Hypothesis Testing ...
cosmosweb.champlain.eduChapter 8: Hypothesis Testing - One Sample Here we see how to use the TI 83/84 to conduct hypothesis tests about proportions and means. The software will calculate the test statistic and the P-value for the test statistic. It does not give you the critical value.
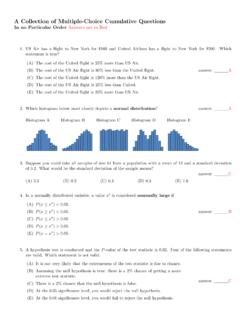
A Collection of Multiple-Choice Cumulative Questions In …
cosmosweb.champlain.eduA Collection of Past Questions Organized by Chapter Chapter 1: Sampling, Levels of Measurement, Percentages 1.A random sample is one with which characteristic? (A)Its members are chosen haphazardly. answer: (B)Every member of the population has an equal chance of being chosen for the sample.
Related documents

Introduction to Microsoft Office PowerPoint 2010
himmelfarb.gwu.eduYou’ll now see a split screen; PowerPoint is on the left and Microsoft Excel has just launched and appears to the right, with sample chart data displayed. Data for PowerPoint charts is actually entered in Excel. As you enter your own data in place
Microsoft Excel Tips & Tricks - Queen's U
www.queensu.cachange > For Excel 2007+ use the formatting tools on the Home tab of the ribbon or for Excel 2003 use the formatting icons on the toolbar. Move, insert and copy columns, rows and cells using the Mouse + SHIFT or CTRL. 40. Move column, row or cells: Select the range of cells, column(s) or row(s) > hover your
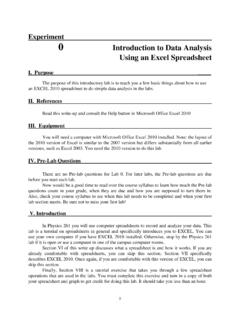
Introduction to Data Analysis Using an Excel Spreadsheet
www.physics.umd.eduUsing an Excel Spreadsheet. I. Purpose _____ The purpose of this introductory lab is to teach you a few basic things about how to use an EXCEL 2010 spreadsheet to do simple data analysis in the labs. II. References . Read this write-up and consult the Help button in Microsoft Office Excel 2010 . III.
Microsoft Excel Cheat Sheet - CustomGuide
www.customguide.comExcel Cheat Sheet Basic Skills The Excel Program Screen Keyboard Shortcuts Getting Started Create a Workbook: Click the File tab and select New or press Ctrl + N. Double-click a workbook. Open a Workbook: Copy Click the File tab and select Open or press Ctrl + O. Select a recent file or navigate to the location where the file is saved.
How To Use VLOOKUP in Excel - Productivity Portfolio
www.timeatlas.comFeb 15, 2015 · How To Use VLOOKUP in Excel - 7 8. In the Lookup_value text box, type "C2" In this step, we're asking excel to look up the contents of cell "c2". Notice how Excel displays the cell's value of "A" to the right of the text box. This helps you …
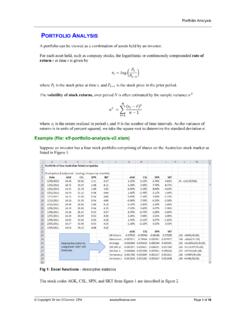
Portfolio analysis - Excel and VBA
excelatfinance.comcompounded return series, using the Excel LN function, are calculated in the range G9:J21 . Summary information from Excel statistical functions are shown in rows 23 to 27, using the Excel 2007 formulas for standard deviation and variance (the Excel 2010 equivalent formula is in …
EXCEL BASICS: MICROSOFT OFFICE 2010
ils.unc.eduKeep in mind that the Formatting toolbar in Microsoft Excel 2010 is exactly the same as the one used for Microsoft Word 2010. The biggest difference between the two programs is that, in Excel, the format is set for each individual cell. So if you change the font and applied the bold option in cell C5, then this format will only be applied to ...
If you are getting blank excel sheet after downloading ...
www.tjxvendors.comSecurity update for Microsoft Excel 2010 (KB3115322). 2. Security update for Microsoft Excel 2013 (KB3115262). 3. Security update for Microsoft Excel 2016 (KB3115272). Please enter the update code (like KB3115322) in the upper right corner search box to check if it is
Better Exponential Curve Fitting Using Excel
www.mikemiddleton.comExcel 2010 Solver Options Dialog Boxes DSI 2010 San Diego www.DecisionToolworks.com 12 . Results for Exponential Fit using Solver Excel’s Trendline reported R Squared = 0.9828, but its actual R Squared = 0.802 and StDev(Residuals) = $1,763 Solver’s better fit …

Excel Functions (fx
www.troyclic.orgExcel Functions (fx) Excel has prewritten formulas called functions to help simplify making complicated calculations. A function takes a value or values, performs an operation, and returns a result to a cell. The values that you use with a function are …