
Using SPSS, Chapter 8: Hypothesis Testing - One Sample
de ned appropriately. The most important distinctions are { TYPE : The most common types are Numeric: Used for quantitative data. These are numbers with no commas and a period delimiting the decimal places. SPSS will not allow you to enter non-numeric characters into a cell of numeric type. Date: Used for dates or times from a menu of formats.
Download Using SPSS, Chapter 8: Hypothesis Testing - One Sample

Information
Domain:
Source:
Link to this page:
Documents from same domain
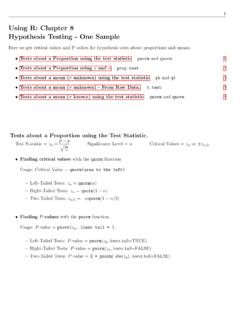
Using R: Chapter 8 Hypothesis Testing - One Sample
cosmosweb.champlain.eduUsing R: Chapter 8 Hypothesis Testing - One Sample Here we get critical values and P-values for hypothesis tests about proportions and means. Tests about a Proportion using the test statistic pnorm and qnorm. 1 Tests about a Proportion using xand n prop.test 2 Tests about a mean (˙unknown) using the test statistic pt and qt 3

Using Excel, Chapter 8: Hypothesis Testing - One Sample
cosmosweb.champlain.eduChapter 8.2 - Hypothesis Testing About a Proportion Notation { Test Statistic = z ^p = p^ p q pq n { Signi cance Level = (in decimal form) { Critical Values = z or z =2 Finding Critical Values Here we use the NORM.S.INV function. NORM.S.INV stands for the inverse of the standard normal distribution (z-distribution).

Using SPSS, Chapter 9: Hypothesis Testing - Two Samples
cosmosweb.champlain.eduChapter 9.2 - Hypothesis Tests for Two Means: Independent Data 4 SPSS does this really well but you do need the raw data1. Click here for online calculators that work well with summary statistics. Chapter 9.3 - Hypothesis Tests for Two Proportions 6 SPSS doesn’t do this the same way it is done in the book.
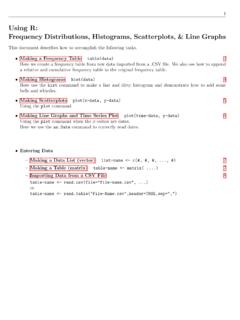
Using R: Frequency Distributions, Histograms, Scatterplots ...
cosmosweb.champlain.eduThen we created a relative and cumulative frequency table from this. Frequency Distribution: Males Scores Frequency 30 - 39 1 40 - 49 3 50 - 59 5 60 - 69 9 70 - 79 6 80 - 89 10 90 - 99 8 Relative Frequency Distribution: Males Relative Scores 30 - 39 2.4% 40 - 49 7.1% 50 - 59 11.9% 60 - 69 21.4% 70 - 79 14.3% 80 - 89 23.8% 90 - 99 19.0% ...

Using R, Chapter 6: Normal Distributions pnorm and …
cosmosweb.champlain.edu1 Using R, Chapter 6: Normal Distributions The pnorm and qnorm functions. Getting probabilities from a normal distribution with mean and standard deviation ˙

Using the TI-83/84 Plus Chapter 8: Hypothesis Testing ...
cosmosweb.champlain.eduChapter 8: Hypothesis Testing - One Sample Here we see how to use the TI 83/84 to conduct hypothesis tests about proportions and means. The software will calculate the test statistic and the P-value for the test statistic. It does not give you the critical value.
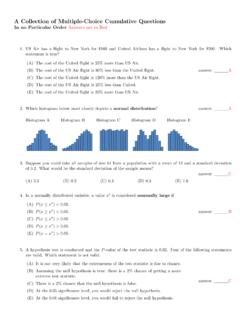
A Collection of Multiple-Choice Cumulative Questions In …
cosmosweb.champlain.eduA Collection of Past Questions Organized by Chapter Chapter 1: Sampling, Levels of Measurement, Percentages 1.A random sample is one with which characteristic? (A)Its members are chosen haphazardly. answer: (B)Every member of the population has an equal chance of being chosen for the sample.
Related documents

SPSS: ANOVA de un Factor - UV
www.uv.esSPSS: ANOVA de un Factor El análisis de varianza (ANOVA) de un factor nos sirve para comparar varios grupos en una variable cuantitativa. Esta prueba es una generalización del contraste de igualdad de medias para dos muestras independientes. Se aplica para contrastar la igualdad de medias de tres o más poblaciones

PRIMEROS PASOS EN SPSS - Consejo Superior de ...
humanidades.cchs.csic.esPrimeros pasos en SPSS - Etiquetas de las variables. - Etiquetas a los valores de las variables. - Valores missing. Etiquetas de las variables: es una cadena de caracteres asociada al nombre de la variables, con el fin de generar resultados más comprensivos, por ejemplo la

Manual de Uso de SPSS - Universidad Nacional de Educacion ...
e-spacio.uned.esA finales de la decada de los 80 SPSS desarrolló un programa de análisis estadístico para su ejecución en los ordenadores personales, bajo el entorno operativo MS-DOS. Hasta entonces había versiones del mismo para grandes plataformas (mainframe),

Statistics 203: Introduction to Regression and Analysis of ...
statweb.stanford.edu- p. 1/19 Statistics 203: Introduction to Regression and Analysis of Variance Fixed vs. Random Effects Jonathan Taylor

Installation SPSS 27 Pour Windows et pour macOS
bib.umontreal.caSPSS Installation SPSS 27 pour Windows et macOS. L’université fournit gratuitement le logiciel d’analyse statistique à tous les membres de sa comm unauté. Le logiciel peut être installé sur un portable ou un ordinateur à la maison. L’installation requiert le. code d’accès (ex. ab12345 ou p1234567) et le . UNIP / mot de passe.

Capítulo 1 «Estructura del SPSS» - UM
www.um.esEl SPSS abre el cuadro de diálogo Frecuencias, cuyos detalles muestra la figura 1.5. La mayor parte de los cuadros de diálogo propios del SPSS poseen una estructura similar: Imagen 1.5. Contenido del cuadro de diálogo Frecuencias . 7 «Lista de variables del archivo de datos».

Mediator- und Moderatoranalyse mit SPSS und PROCESS
www.uni-trier.deMediator- und Moderatoranalyse mit SPSS und PROCESS 2 Herausgeber: Zentrum für Informations-, Medien- und Kommunikationstechnologie (ZIMK) an der Universität Trier Universitätsring 15 D-54286 Trier WWW: zimk.uni-trier.de E-Mail: zimk@uni-trier.de Tel.: (0651) 201-3417, Fax.: (0651) 3921

Introducción al SPSS: Prueba t - Universitat de València
www.uv.esDespués de asumir las varianzas iguales (en el caso de las 2 variables “tensión antes” y “tensión después”) observamos el estadístico t con su nivel de significación bilateral, este valor nos informa sobre el grado de compatibilidad entre la hipótesis de igualdad de medias y las diferencia entre medias poblacionales