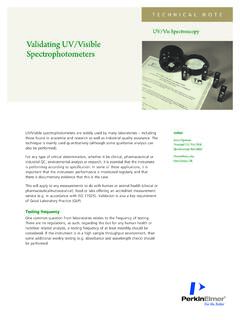
Validating UV/Visible Spectrophotometers
UV/Vis Spectroscopy Validating UV/Visible Spectrophotometers Author Steve Upstone Principal UV/Vis/NIR Spectroscopy Specialist PerkinElmer, Inc. Seer Green, UK. 2 Testing wavelength accuracy Wavelength accuracy is normally assessed by using either a sample containing a series of very sharp peaks such as a
Download Validating UV/Visible Spectrophotometers

Information
Domain:
Source:
Link to this page:
Documents from same domain

Lambda 650, 800, and 950, Spectrophotometers
resources.perkinelmer.comsensitivity UV/Vis and NIR detectors for demanding transmission measurements on liquids and solids. See inside spread for details. The dual compartments in the LAMBDA Series are the largest in the industry. The primary compartment is used for a wide range of standard reflectance and transmission accessories and polarizers, while the

PinAAcle 500/900 AA Spectrometers - PerkinElmer
resources.perkinelmer.comAA spectrometers are normally installed on laboratory work benches or tables. The benchtop or area in which the AA instrument is to be installed should be large enough to accommodate the instrument and all accessories (dimensions of those items are given in Section 10). A custom PinAAcle heavy-duty rolling bench, with locking
The Analysis of a Broad Range of Organic Acids by HPLC ...
resources.perkinelmer.comThe Analysis of a Broad Range of Organic Acids by HPLC with UV Detection Author: PerkinElmer Inc. Subject: This application brief provides a routine and reproducible method for the HPLC analysis of 11 organic acids commonly found in juices and other beverages. Keywords
Sensitivity, Background, Noise, and Calibration in Atomic ...
resources.perkinelmer.comthe signal is small relative to the background. It is common to express the relationship between signal and background as the “signal-to-background ratio” or S/B. (This is often referred to as “signal-to-noise” or S/N, but background and noise are two distinct characteristics). The above example would have an S/B of 0.1.
A Beginner’s Guide Introduction - PerkinElmer
resources.perkinelmer.comBoth styles take advantage of gravity to obtain ... TGA 8000 and the TGA 4000 are controlled by PerkinElmer’s proprietary thermal software, Pyris Software, and have autosampler accessories for unattended operation. ... As a new TGA user, it is best to check calibration .
Analysis of Wastewater for Metals using ICP-OES
resources.perkinelmer.comabsorption spectroscopy (AAS), inductively coupled plasma optical emission spectroscopy (ICP-OES) and ICP mass spectrometry (ICP-MS). Depending upon the number of elements that need to be determined and the number of samples that need to be run, the most suitable technique for business requirements can be chosen.
Determination of Relative Fluorescence Quantum Yields ...
resources.perkinelmer.comrequires knowledge of the refractive index of the solvent, and the absorbance of both reference and sample. The relative method provides good accuracy for solution phase samples (as it uses the gradients to calculate the ΦF), with the added benefit of not requiring an integrating sphere.8 The fundamental principle of the comparative method is that
WHITE Top Ten ChemDraw® Tips and Tricks That Many …
resources.perkinelmer.coma high-quality software application to process NMR and LC/MS, GC/MS data. A key aspect Mnova users enjoy is the ability to copy/paste ChemDraw structures onto their NMR spectra as annotations. 7 HELM Libraries (ChemDraw 17.0 and 18.0) ChemDraw is not only about small molecules. ChemDraw 13 introduced the Biopolymer toolbar, which enabled users to
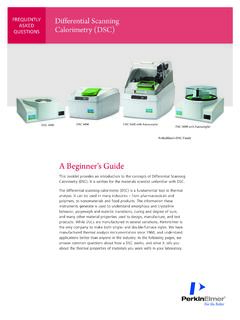
A Beginner's Guide - PerkinElmer
resources.perkinelmer.comA For the vast majority of simple applications, the data from both types of instruments are comparable and both instruments can provide good data. However, both designs have strengths and weaknesses, and if you are doing more than just looking at simple glass transitions and melts, you may need one or the other. Some of the differences are

The 30-Minute Guide to ICP-MS - PerkinElmer
resources.perkinelmer.comthe world as the instrument of choice for performing trace metal analysis. While atomic absorption (AA) and inductively coupled plasma-optical emission (ICP-OES) systems dominate the inorganic analysis landscape, ICP-MS continues to make inroads into laboratories that are requiring the lowest detection limits and the greatest level of productivity.
Related documents
A09-009A Determination of Aspirin Using UV and Visible …
www.jenway.comtablets using UV and Visible wavelength spectroscopy Introduction Since its market introduction in 1899 under the trademark Aspirin®, acetylsalicylic acid has attained a leading worldwide position in the nonprescription treatment of pain, inflammation, and fever. It has proven effective as a general pain reliever, and it is routinely used in a ...
Module 1: Fundamentals of Spectroscopy
ocw.mit.edumolecular vibrational oscillations. Visible and UV light drive electron clouds to move in an oscillatory fashion about their host nuclei. RF radiation drives magnetic dipoles in an oscillatory fashion, as any oscillating magnetic field drives a bar magnet. Where possible, we will use classical mechanics to explain spectroscopy.
CHAPTER 2 ULTRAVIOLET-VISIBLE ABSORPTION …
ocw.ump.edu.mySpectroscopy •Size of curvette = 1cm x 1cm (square base) •Volume used= 0.5ml to 2ml depending on the sample size. Some typical UV and visible absorption cells [Picture taken from Analytical Chemistry by Gary D. Christian Page 427]

Fundamentals of UV-Visible Spectroscopy (5965-5123E)
web.uni-plovdiv.bg(3 × 10⁸ ms-1), and λ is wavelength (in meters). In UV-visible spectroscopy, wavelength usually is expressed in nanometers (1 nm = 10-9m). It follows from the above equations that radiation with shorter wavelength has higher energy. In UV-visible spectroscopy, the low-wavelength UV light has the highest energy. In some cases,

Spectroscopy in the UV and Visible: Instrumentation
blamp.sites.truman.eduSpectroscopy in the UV and Visible: Instrumentation • Components may not (at typically are not) useful for all wavelength ranges. – Composition, construction limit components to finite useful wavelength ranges. 2 3 UV-Vis Sources • Typically continuum sources

The Use of UV-visible Spectroscopy to Measure the Band …
mmrc.caltech.eduThe Use of UV-visible Spectroscopy to Measure the Band Gap of a Semiconductor Zhebo Chen and Thomas F. Jaramillo Department of Chemical Engineering, Stanford University Edited by Bruce Brunschwig 09/19/2017 Section 1: Introduction to UV-Vis spectroscopy In ultraviolet-visible light (UV-vis) spectroscopic, light absorption is measured as

The Basics of UV-Vis Spectroscopy
www.agilent.com1.3 UV-visible spectra When radiation interacts with matter, several processes can occur, including reflection, scattering, absorbance, fluorescence/ phosphorescence (absorption and re-emission), and photochemical reactions (absorbance and bond breaking). Typically, when measuring samples to determine their UV-visible spectrum, absorbance is ...

INTRODUCTION A Tl 857 ULTRAVIOLET-VISIBLE …
www.bioglobax.comard absorption bands in holmium oxide solution for UV/visible molecular absorption spectrophotometry. J Phys Chem Ref Data. 2005;34(1):41–57. The maximum 95% measurement uncertainty is ±0.06 nm. 2 á857ñ Ultraviolet-Visible Spectroscopy / Physical Tests USP 40
Chapter 4 Ultraviolet and visible Absorption Spectroscopy
www.philadelphia.edu.joUltraviolet and visible Absorption Spectroscopy . ... visible 4-7.5x10¹⁴ outer electron molecular vibrations 2.5 µm-750 nm 1x10¹⁴-4x10¹⁴ near- ... 2 absorption is in the deep UV, it has an energy similar to that in ethylene • The longest wavelength absorption is due to

Module 2 Spectroscopic techniques Lecture 3 Basics of ...
www.nptel.ac.iniv. UV/Visible region: UV and visible regions are involved in the electronic transitions in the molecules. The spectroscopic methods using UV or visible light therefore come under ‘Electronic spectroscopy’. v. X-ray radiation: X-rays are high energy electromagnetic radiation and causes transitions in the internal electrons of the molecules.