Transcription of The long and short of TIPS - Vanguard
1 Connect with Vanguard > Executive summary. Assets can be considered an inflation hedge if either their purchasing power is maintained over the long run or their nominal returns closely track realized inflation over shorter horizons. Since the introduction of the Treasury Inflation Protected Securities ( tips ) market in 1997, broad-market tips returns have generally met both criteria. That said, the aggregate tips market carries considerable interest rate risk, compared to shorter-maturity tips benchmarks. This paper compares the correlation of inflation with tips benchmarks in three distinct maturity buckets. We then compare their inflation-hedging properties to those of other asset found that the return on a short -term tips benchmark (of 0-to-5-year maturities) has been more highly correlated to actual monthly and yearly CPI (Consumer Price Index) inflation than other segments of the tips market over the past decade.
2 Although, in practice, all tips securities Vanguard research October 2012 The long and short of TIPSA uthorsJoseph Davis, Aliaga-D az, J. Thomas, CFAN athan Zahm, FSA2 receive the same CPI principal adjustment, short -term tips returns tend to most closely track actual CPI inflation because of their lower duration and greater responsiveness to temporary, unexpected inflation spikes. We found similar results for the United Kingdom s inflation-linked gilt market, which has existed since 1981. short -term tips returns have shown markedly lower volatility, yet a similar or higher inflation correlation, than that observed for certain real assets such as REITs, commodity futures, and results imply that a short -term tips portfolio may be a more appropriate inflation-sensitive investment than the broad tips market for risk-averse investors who want their total portfolio to more closely track realized CPI inflation over short horizons.
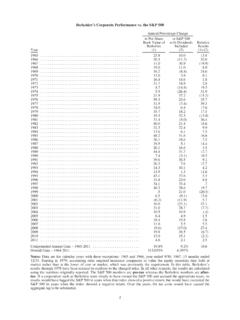
3 Of course, the higher inflation correlation of short -term tips comes at a cost a lower expected income return versus that of the broad tips market. In this sense, the risk return trade-offs of investing in a short -maturity versus a longer-maturity tips portfolio parallel those involved when selecting the interest rate exposure of any other bond Treasury inflation-protected securities were introduced by the Department of the Treasury in January 1997. Since then, the outstanding supply of tips has grown substantially, from a market capitalization of approximately $31 billion at the end of 1997 to nearly $800 billion as of August 2012. This increased supply, in conjunction with occasional changes in the size and maturity of Treasury tips issuance, has produced a more even distribution in the market cap and representation of tips across the yield shown in Figure 1, securities in the short -term Barclays tips 1 5 Year Index now make up approximately 35% of the aggregate Barclays tips Index, a weighting similar to the market-cap shares of the intermediate-term (5 10 Year) and long -Notes on risk: All investments are subject to risk, including the possible loss of the money you invest.
4 Past performance is no guarantee of future returns. While Treasury or government agency securities provide substantial protection against credit risk, they do not protect investors against price changes due to changing interest rates. Unlike stocks and bonds, Treasury bills are guaranteed as to the timely payment of principal and interest. Diversification does not ensure a profit or protect against a loss in a declining market. The performance of an index is not an exact representation of any particular investment, as you cannot invest directly in an index. Bond funds are subject to interest rate risk, which is the chance that bond prices overall will decline because of rising interest rates, as well as to credit risk, which is the chance that a bond issuer will fail to pay interest and principal in a timely manner or that negative perceptions of the issuer s ability to make such payments will cause the price of that bond to More precisely, the tips inflation adjustment, or accrual, occurs with an indexation lag to the non-seasonally adjusted City Average All-Items CPI, calculated by the Bureau of Labor Statistics.
5 Since tips principal is adjusted to CPI changes, it responds to both inflation and deflation, but with a floor at the par value of the tips . Since the interest rate is applied to the principal, both principal and coupon payments are effectively indexed to the CPI. For details, see G rkaynak, Sack, and Wright (2008).3term (10+ Year) Barclays tips indexes. This stands in stark contrast to 2000, when the market cap of a short -term tips benchmark was about 10%. Most of this growth in the 1 5 year market took place in the early 2000s, a natural evolution of the market due to longer-maturity issues rolling down the yield curve. Today, tips securities with less than or equal to 5 years maturity tend to have greater liquidity (in terms of bid-ask spreads) and trading volume than longer-maturity tips securities (Fleming and Krishnan, 2009).
6 Inflation protection and sensitivity: Do they vary by tips maturity? In practice, all tips securities receive the same adjustment (or indexation ) of their coupon and principal payments based on changes in the Consumer Price In this sense, tips portfolios of alternative maturities share the same level of inflation protection as defined by the principal and coupon CPI adjustment. Of course, the observed correlation or sensitivity between the total return on a tips portfolio and actual CPI inflation may vary by the duration or interest rate exposure of the tips portfolio itself. This is because the total return on a tips portfolio reflects not only the inflation accrual but the income and capital appreciation/depreciation associated with the level of and changes in tips yields. Only in the (unlikely) event that all tips yields are both identical ( , a flat tips yield curve) and unchanged will tips benchmarks of various maturities have both an equal return and an identical correlation with inflation.
7 In reality, the inflation sensitivity of tips 2002200320042005200620072008200920102 0112012 Sources: Vanguard calculations, based on data from Barclays. Notes: Year in Barclays tips indexes represents years to maturity. The aggregate Barclays tips Index excludes tips securities with less than 1 year of maturity. As of July 2012, approximately of the market cap of the Barclays tips 0 5 Year Index (not shown here) comprised tips securities of less than 1 year 5 Year tips Index5 10 Year tips Index10+ Year tips IndexPercentage of market cap of Barclays tips Index Evolution of tips market and maturity segments: January 2002 through July 2012010203040506070%4 portfolios should be expected to vary by maturity, given the response of the tips and nominal Treasury yield curves to both realized and unanticipated changes in assess whether this has indeed been the case historically, Figure 2 presents the average correlation of inflation with the broad Barclays tips Index as well as Barclays tips benchmarks of three different maturity buckets a short -term tips index Figure correlation to changes in CPI Correlation coef cients of various bond benchmarks to in ation.
8 September 2002 July 2012 TIPSLong-termTIPSB road marketBroad marketTotal marketCash based on 12-month rolling returnsCorrelations based on monthly 0 5 Year 5 10 Year 10+ Year tips tips tips tips Treasury Aggregate Index Index Index Index Index Bond Index CashAnnualized total return maturity (years) return volatility 12-month return 12-month return 0%Correlation to stocks to aggregate bonds to cash Sources: Vanguard calculations, based on data from Barclays and Bureau of Labor : short -term tips Index represented by Barclays tips 0 5 Year Index; intermediate term tips represented by Barclays tips 5 10 Year Index; long -term tips represented by Barclays tips 10+ Year Index; broad tips market represented by Barclays tips Index; broad Treasury market represented by Barclays Treasury Index; total bond market represented by Barclays Aggregate Bond Index; and Cash represented by Barclays 1 3 Month Treasury Bill Index.
9 Table beneath the figure provides additional historical return, volatility, and correlation statistics for these benchmarks for the period September 2002 July 2012. 2 The difference between the yields of a nominal Treasury bond and a similar-maturity tips bond is known as the break-even inflation rate (BEI). The BEI rate represents not only the bond market s expectation of future inflation over the life (or maturity) of the two bonds but also risk premiums that reflect the uncertainty about future inflation and the bonds relative liquidity, among other factors. In this sense, the BEI is the rate of inflation that would give an investor the same return at maturity on both a nominal Treasury security and a tips security with identical maturities. The performance of a tips portfolio relative to that of a portfolio of similar-maturity nominal Treasury bonds is determined not only by the level of actual inflation but also by whether that realized inflation has exceeded the BEI rate at the time the portfolio was purchased.
10 For further details, see Wallick and Marshall (2009).53 At a monthly frequency, actual percentage changes and unexpected changes in the CPI inflation rate are highly correlated, since expected inflation rates tend to be persistent, or smooth. 4 The currently low (even negative) tips real yields also suggest that the future returns of tips benchmarks of all maturity buckets are likely to underperform the returns realized in the table to Figure 2 for the period September 2002 July 2012. For further discussion, see Donaldson, Philips, and Walker (2012). Figure + Year tips Index0 5 Year tips IndexIn ationCashRolling 12-month returns and year-over-year percentage change in CPI in ation The rolling returns of short -term and long -term tips versus in ation: August 2003 July 2012 Sources: Vanguard calculations, based on data from Barclays and Bureau of Labor Statistics.