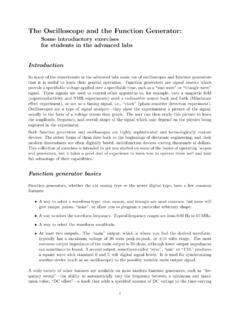
Transcription of The Oscilloscope - Michigan State University
1 Experiment5 The Objectives Explain the operation or effect of each control on a simple Oscilloscope . Display an unknown sinusoidal electrical signal on an Oscilloscope andmeasure its amplitude and IntroductionSo far, we ve been using a voltmeter to measure a voltage. That s all welland good if the voltage is steady or DC electricity. But what if the electricalvoltage you want to measure is varying rapidly in time? The voltmeterdisplay may oscillate rapidly preventing you from making a good reading,or it may display some average of the time-varying voltage. In this case,an Oscilloscope can be used to observe and measure the entire time-varyingvoltage, or signal .The Oscilloscope places an image of the time-varying signal on the screenof a cathode ray tube (CRT) allowing us to observe the shape of the signaland measure the voltage at different times.
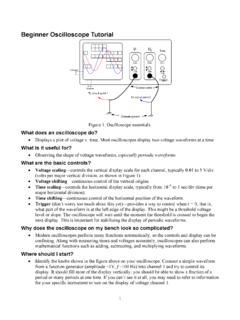
2 If the signal is periodic (itrepeats itself over and over) we can also measure the frequency, the rate ofrepeating, of the The Key ConceptsAs always, you can find a summary online at : waves, TheoryWhat the Oscilloscope doesAn Oscilloscope plots voltage as a function of are two types of voltages: AC and DC. So far this semester wehave been concerned with DC (or direct current ) that indicates a voltagewhose magnitude is constant in time. In contrast, AC (short for alternatingcurrent ) indicates a voltage whose magnitude varies as a function of example of an AC signal is shown in (y)axisandthetimeisonthehorizontal(x) axis. Notice thatif we plotted a DC (or constant) voltage on this figure it would be a flathorizontal today s lab we will use an Oscilloscope to look at some AC Oscilloscope has controls to make thexandyscales larger or act like the controls for magnification on a microscope.
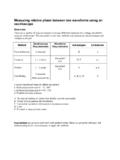
3 They don tchange the actual voltage any more than magnification makes a cell on themicroscope slide bigger; they just let us see small details more easily. Thereare also controls to shift the center points of the voltage scales. These offset knobs are like the controls to move the stage of the microscope tolook at different parts of a sample. You will learn about other adjustmentsin the course of the updated February 15, TheoryFigure : Graph of an oscillating the Oscilloscope measuresThere are two main quantities that characterize any periodic AC signalwhich can be measured with the aid of an Oscilloscope . The first is thepeak-to-peak voltage(Vpp), which is defined as the voltage differencebetween the time-varying signal s highest and lowest voltage (see the sinewave shown in ). The second is thefrequencyof the time-varyingsignal (f), defined byf=1T,( )wherefis the frequency in hertz (Hz) andTis the period in seconds (s)(the period is also shown in ).
4 Last updated February 15, 2013835. The OscilloscopeFigure : Graph of voltage vs. time, illustrating the period (T), peak-to-peak voltage (Vpp)andamplitude(V0) the angular frequency in rad/s is used instead of the fre-quencyfin are related by =2 f( )The form of the voltage as a function of time for a standard AC signalisV(t)=V0sin(2 ft)+VDC,( )2 Radian is a unit of angular distance. You are probably more familiar with there are 360 degrees in a full circle, there are 2 updated February 15, In today s labwhereVDCis an optional constant DC offset that shifts the sine wave upor down andV0is the amplitude and is related to the peak-to-peak voltageVppof the signal byVpp=2V0.( )Notice that the 2 in it so that if the frequencyfis 1 Hz,then the sine wave travels a full cycle in 1 s, which is what we would expectfrom that In today s labIn this experiment you will familiarize yourself with the use of an oscil-loscope.
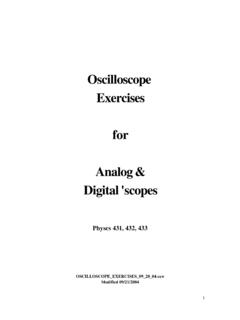
5 Using a signal generator you will produce various time-varyingvoltages (signals) which you will input into the Oscilloscope for Equipment Oscilloscope . Signal generator. BNC-to-banana Tips When plugging or unplugging wires, firstturn offall electronicsthat are connected,orwillbecomeconnected, Oscilloscope contains a cathode ray tube (CRT), in which the deflectionof an electron beam that falls onto a phosphor screen is directly propor-tional to the voltage applied across a pair of parallel deflection plates. Ameasurement of this deflection yields a measurement of the applied Oscilloscope can be used to display and measure rapidly varying elec-trical phenomena. The internal subsystems of the Oscilloscope are shown the front panel of the Oscilloscope is shown in updated February 15, 2013855. The OscilloscopeFigure : Diagram of subsystems in an : Front panel of an updated February 15, EquipmentFigure : The left side of the scope front ll need to be able to read the dials and markings, blowups of the leftand right halves of the front panel are shown in deflection plates.
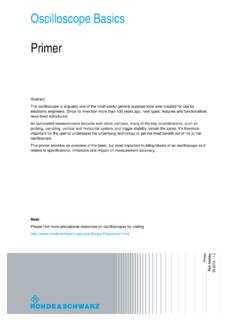
6 It servesto amplify the input signal to they-plates so that the CRT can show anappreciable vertical displacement for a small signal. The horizontal ampli-fier serves the same purpose for thex-axis plates and the horizontal an external input signal can be applied to thex-axis input, thisfunction of the Oscilloscope is not used in this course. Instead, a sweep gen-erator, which is internal to the Oscilloscope , is used to control the horizontaldisplay. The sweep generator makes a beam move in thex-direction at aconstant, but adjustable, speed. The beam s speed is adjusted using thetime base (TB) control knob. This allows the Oscilloscope to display theexternaly-input signal as a function of sweep generator functions in the following way. A saw-tooth voltageis applied to the horizontal deflection plates. A saw-tooth voltage is atime-varying periodic voltage and is shown in (a).
7 The voltageLast updated February 15, 2013875. The OscilloscopeFigure : The right side of the scope front increases linearly with time and then abruptly drops to zero. As thevoltage increases the beam is deflected more and more to the right of theCRT screen. When the voltage reaches its maximum value, the beam tracewill be at the far right hand side of the screen (x= 10 cm). The voltagethen abruptly retraces back to zero during this phase the signal is notdisplayed on the scope. The result is that the beam spot sweeps acrossthe screen with the same frequency as the saw-tooth signal. The horizontalposition of the beam spot is shown in (b). Note that the time ittakes the beam spot to move across the screen (sweep time) is equal to theperiod of the saw-tooth signal. The rate at which the beam spot sweepsacross the screen is selected by using the time base (TB) selector knob andis calibrated in time/cm.
8 Because both the phosphor screen and the human88 Last updated February 15, Equipment(a) Voltage supplied to horizontal plates of oscillator.(b) Deflection of beam on CRT of Oscilloscope . Thesweep time is one period of the saw-tooth : Saw-toot input to have some finite retention time, the beam spot looks like a continuouscurve at frequencies higher than about 15 updated February 15, 2013895. The OscilloscopeFigure : The signal signal generatorTo investigate how the Oscilloscope works in this first experiment, we willneed to give it a test input signal. To accomplish this, we will be using asignal generator like the one pictured in is important to understand the function of all of the dials and switcheson the signal generator that are described below: The digital read out (upper left) displays the frequency that the signalgenerator is currently set to.
9 This readout is in hertz (Hz). The RANGE buttons (to the right of the display) will move the dec-imal in the read out left or right. This means that by pressing thebutton once, we can change the frequency by a factor of ten. In theexample pictured, one press of the button would change the frequencyfrom Hz to either Hz or 9 Hz, depending on whichdirection we move the decimal. This will allow us to generate a largenumber of different frequencies quickly and easily. This only movesthe decimal; it does not change the numbers that are displayed. If we wish to make a different numerical value, we need to turn theknob immediately below the range buttons, marked ADJUST. This90 Last updated February 15, ProcedureFigure : Cartoon of BNC-to-banana works in a rather unique way. If the knob is turned quicklythe numbers change quickly.
10 If we turn the knob slowly, the digitschange slowly. So, with our frequency set at Hz, as in theexample above, if we wish to set it to Hz, we would turn theknob slowly. If we wanted to set it to Hz, we could turn theknob the same amount, but turn it faster so the digits change may seem a little bit awkward at first, but it gives us quick accessto a large range of frequencies. At the top is a setting labeled WAVEFORM. By changing this setting,we can create smooth sine curves, square waves or triangular LED will light up next to the type of wave selected. Below the waveform setting is a knob labeled AMPLITUDE. By ro-tating this knob, we can change the amplitude or height of our amplitude will be measured using the Oscilloscope . The far right hand side is the OUTPUT of the signal generator. Thisis where we connect the cables to take the signal to an Oscilloscope oran external circuit.