Transcription of 20 The Laplace Transform
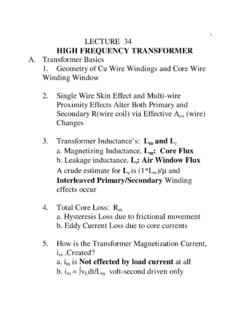
1 20 The Laplace Transform Recommended Problems Consider the signal x(t) = 3e 2'u(t) + 4e3'u(t). (a) Does the Fourier Transform of this signal converge? (b) For which of the following values of a does the Fourier Transform of x(t)e -" converge? (i) a = 1 (ii) a = (iii) a = (c) Determine the Laplace Transform X(s) of x(t). Sketch the location of the poles and zeros of X(s) and the ROC. Determine the Laplace Transform , pole and zero locations, and associated ROC for each of the following time functions. (a) e -"u(t), a > 0 (b) e ~atu(t), a < 0 (c) -e -a tu(-t), a < 0 Shown in Figures to are four pole-zero plots. For each statement in Table about the associated time function x(t), fill in the table with the cor-responding constraint on the ROC.
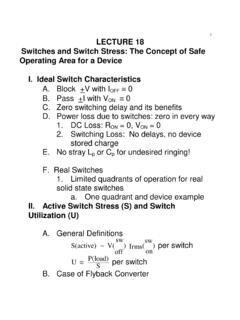
2 (a) (b) Im s plane O -Re -2 2 Figure P20-1 Signals and Systems P20-2 (c) (d) Im s plane X O Re -2 2 Figure Constraint on ROC for Pole-Zero Pattern x(t) (a) (b) (d) (i) Fourier Transform of x(t)e -' converges (ii) x(t) = 0, t > 10 (iii)x(t) = 0, t < 0 Table Determine x(t) for the following conditions if X(s) is given by 1 X(s) = _____(s + 1)(s + 2) (a) x(t) is right-sided (b) x(t) is left-sided (c) x(t) is two-sided An LTI system has an impulse response h(t) for which the Laplace Transform H(s) is H(s) = h(t)e -dt = s 1' Re{s} > -1 Determine the system output y(t) for all t if the input x(t) is given by x(t) = e t'2 + 2e -t 3 for all t.
3 The Laplace Transform / Problems P20-3 (a) From the expression for the Laplace Transform of x(t), derive the fact that the Laplace Transform of x(t) is the Fourier Transform of x(t) weighted by an exponential. (b) Derive the expression for the inverse Laplace Transform using the Fourier Transform synthesis equation. Optional Problems Determine the time function x(t) for each Laplace Transform X(s). 1(a) , Re'{s}> -1 s + 1 1 (b) , R {s) < -1 s +1 (c) RsRefs) > 0 s2 + 4 (d) s +1 Refs) > -2 s2 + 5s + 6' ()2s + 1 Refs) < -3 s2 + 5s + 6' (f) -s + 1 s2(s -1) o < Refs) < 1 s- s + 1 (g) 2 S+1)2 , -1 < Refs) (S + (h) () s + +1 1 Refs) > -1 (s 1)2 + 4' Hint: Use the result from part (c).}
4 The Laplace Transform X(s) of a signal x(t) has four poles and an unknown number of zeros. x(t) is known to have an impulse at t = 0. Determine what information, if any, this provides about the number of zeros. Determine the Laplace Transform , pole-zero location, and associated ROC for each of the following time functions. (a) e atu(t), a < 0 (b) -e"'u(-t), a > 0 (c) e atu(t), > 0 (d) e *t. a > 0 Signals and Systems P20-4 (e) u(t) (f) b(t -to) a > 0(g) L ako(t -kT), k=o (h) cos (wot + b)u(t) (i) sin (oot + b)e --atu(t), a > 0 (a) If x(t) is an even time function such that x(t) = x(-t), show that this requires that X(s) = X(-s). (b) If x(t) is an odd time function such that x(t) = -x(--t), show that X(s) = -X(-s).
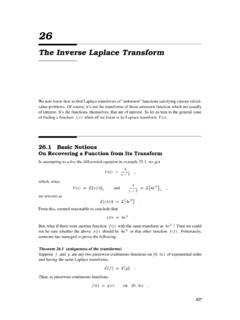
5 (c) Determine which, if any, of the pole-zero plots in Figures to could correspond to an even time function. For those that could, indicate the required ROC. (i) (ii) .x (Re C x (Re-1 11-1 1 Figure Figure (iii) (iv) x 0 Re 1e -1 1 Figure Figure (d) Determine which, if any, of the pole-zero plots in part (c) could correspond to an odd time function. For those that could, indicate the required ROC. MIT OpenCourseWare Resource: Signals and Systems Professor Alan V. Oppenheim The following may not correspond to a particular course on MIT OpenCourseWare, but has been provided by the author as an individual learning resource. For information about citing these materials or our Terms of Use, visit: 21 Continuous-Time Second-Order Systems Recommended Problems Consider the following four impulse responses: (i) hi(t) = e-"'u(t), a > 0, (ii) h 2(t) =-e -atu(-t), a > 0, (iii) h3(t) = e -atu(t), a < 0, (iv) h 4(t) = -e -a tu(-t), a < 0 (a) Verify that 1 H 2(s) = s+a' with an ROC corresponding to Re{s} < -a.))
6 (b) It is easily verified that in all four cases the system functions ( , the Laplace transforms of the impulse responses) have the same algebraic expression. How-ever, the ROC is different. For each of the four systems, identify which of the s plane diagrams in Figures to correctly represents the associated Laplace Transform , including the ROC. Also indicate which diagrams corre-spond to stable systems. (A) (B) Im Im s plane s plane Re Re Figure Figure (C) (D) Figure Figure P21-1 Signals and Systems P21-2 (E) (F) s plane s plane Re Figure Figure Consider the LTI system with input x(t) = e u(t) and impulse response h(t) = e-2t u(t).
7 (a) Determine X(s) andH(s). (b) Using the convolution property of the Laplace Transform , determine Y(s), the Laplace Transform of the output, y(t). (c) From your answer to part (b), find y(t). As indicated in Section of the text, many of the properties of the Laplace trans-form and their derivation are analogous to corresponding properties of the Fourier Transform developed in Chapter 4 of the text. In this problem you are asked to out-line the derivation for some of the Laplace Transform properties in Section of the text. By paralleling the derivation for the corresponding property for the Fourier Transform in Chapter 4 of the text, derive each of the following Laplace Transform properties.
8 Your derivation must include a consideration of the ROC. (a) Time-shifting property (Section ) (b) Convolution property (Section ) Consider a continuous-time LTI system for which the input x(t) and output y(t) are related by the differential equation d 2y(t) dy(t) _ 2y(t) = x(t) dt2 dt Let X(s) and Y(s) denote the Laplace transforms of x(t) and y(t), and let H(s)denote the Laplace Transform of the impulse response h(t) of the preceding system. (a) Determine H(s). Sketch the pole-zero plot. Continuous-Time Second-Order Systems / Problems P21-3 (b) Sketch the ROC for each of the following cases: (i) The system is stable. (ii) The system is causal.
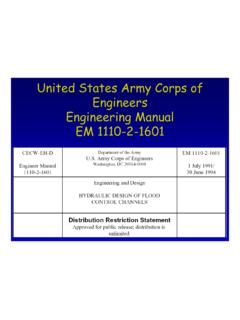
9 (iii) The system is neither stable nor causal. (c) Determine h(t) when the system is causal. Consider the following system function H(s) and its corresponding pole-zero plot in Figure H(s) = ~s +1 Im s plane Re Figure Using the graphical method discussed in the lecture, find IH(O) |, 4 H(O), IH(jl) 1, 4H(jl), |H(joo) , and 4 H(joo). Sketch the functions IH(jw) I and 4H(jw). For the following system function, plot the pole-zero diagram and graphically deter-mine the approximate locations of the peaks and valleys of IH(jW) 1: + 5)sH(s) =(s [s -( + j2)][s -( -j2)] Optional Problems (a) Draw the block diagram for the following second-order system in terms of inte-grators, coefficient multipliers, and adders.
10 2 H(s) = ~2 +2Wn + W2 Signals and Systems P21-4 (b) Sketch the pole-zero plot of H(s) and plot IH(jw)| under the following con-ditions. (i) kept constant, but r is varied from close to 0 to close to 1. (ii) r is kept constant, but w, is varied from about 0 to infinity. You don't have to be precise but show how the bandwidth and location of the peak changes for the two cases above. (a) Consider the following system function H(s). (b) H(s) = + s2 +s+1 s 2 +2s-+2 Draw the block diagram for H(s) implemented as (i) a parallel combination of second-order systems, (ii) a cascade combination of second-order systems. Is implementation (ii) unique?