Example: tourism industry
30 Graphical Representations of Data
If you are comparing two sets of data, you can use a back-to-back stem-and-leaf plot where the leaves of sets are listed on either side of the stem as shown in the table below. ... same amount of apples and oranges was sold on the second day. 8. Figure 30.4 Example 30.3 The figures for total population, male and female population of the UK at ...
Tags:
Information
Domain:
Source:
Link to this page:
Documents from same domain

Lecture Notes in Discrete Mathematics
faculty.atu.eduPreface This book is designed for a one semester course in discrete mathematics for sophomore or junior level students. The text covers the mathematical
Marcel B. Finan Arkansas Tech University All Rights …
faculty.atu.edu43 The Laplace Transform: Basic De nitions and Results Laplace transform is yet another operational tool for solving constant coe -cients linear di erential equations.
Lecture Notes in Actuarial Mathematics A Probability ...
faculty.atu.eduLecture Notes in Actuarial Mathematics A Probability Course for the Actuaries A Preparation for Exam P/1 Marcel B. Finan May 2018 Syllabus
31 Misleading Graphs and Statistics
faculty.atu.edu31 Misleading Graphs and Statistics It is a well known fact that statistics can be misleading. They are often used to prove a point, and …
A Second Course in Elementary Di erential Equations
faculty.atu.edu28 Calculus of Matrix-Valued Functions of a Real Variable In establishing the existence result for second and higher order linear di er-ential equations one transforms the equation into a linear system and tries
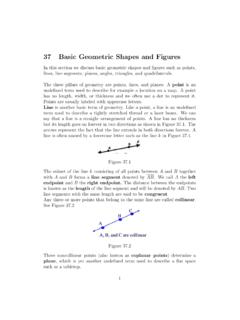
37 Basic Geometric Shapes and Figures
faculty.atu.edu37 Basic Geometric Shapes and Figures In this section we discuss basic geometric shapes and figures such as points, lines, line segments, planes, angles, triangles, and quadrilaterals. The three pillars of geometry are points, lines, and planes: A point is an undefined term used to describe for example a location on a map. A point
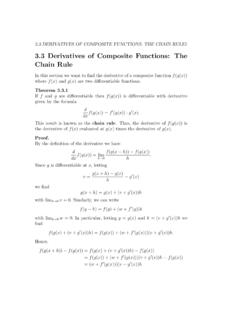
3.3 Derivatives of Composite Functions: The Chain …
faculty.atu.edu3.3 DERIVATIVES OF COMPOSITE FUNCTIONS: THE CHAIN RULE1 3.3 Derivatives of Composite Functions: The Chain Rule In this section we want to nd the derivative of a composite function f(g(x))
CL’s Handy Formula Sheet
faculty.atu.eduCL’s Handy Formula Sheet (Useful formulas from Marcel Finan’s FM/2 Book) Compiled by Charles Lee 8/19/2010. Interest Interest Discount Simple Compound Simple Compound a(t) Period when greater Interest Formulas o Force of Interest o The Method of Equated Time
A Basic Course in the Theory of Interest and Derivatives ...
faculty.atu.eduThe Basics of Interest Theory A component that is common to all nancial transactions is the investment of money at interest. When a bank lends money to you, it charges rent for the money. When you lend money to a bank (also known as making a deposit
An Introductory Guide in the Construction of Actuarial ...
faculty.atu.eduThis is the fth of a series of lecture notes intended to help individuals to pass actuarial exams. The topics in this manuscript parallel the topics ... This book is concerned with the construction and evaluation of actuarial models. The purpose of this chapter is to de ne models in the actuarial setting and suggest a process of building them. 1.
Related documents

Tools For Effective Decision Making
www.fcps.netIt is also an ideal tool for comparing "apples with oranges" - completely different options such as whether to invest in marketing, a new IT system or a new piece of machinery. These decisions are usually much harder than comparing three possible new IT systems, for example. How to use the Paired Comparison worksheet tool:

PracticePractice PuzzlesPuzzles - SharpSchool
p10cdn4static.sharpschool.comComparing and Ordering Fractions Greater Than 10 Least to Greatest 11 LCD and Lowest Terms What Did the Ocean Say to the Seashore? 12 Find the Match 13 ... Because the denominators are different, solving this problem is like adding apples and oranges. Either you need to add in thirds or in ninths—how do you choose? Go for the least common ...

Nutrition 101 - University of Houston
www.uh.eduuseful in comparing the energy available from different foods when we are deciding what food to eat. For example, a small apple contains only 80 ... oat bran, beans, apples, carrots, and other vegetables). Insoluble fiber absorbs water and helps to provide needed bulk to …
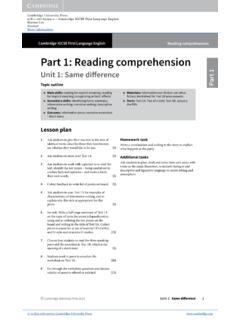
Part 1: Reading comprehension - Cambridge University Press
assets.cambridge.orgprizes which might be won. Egg-and-spoon races, spearing apples in basins of water, blind man’s buff. ‘I don’t want to go,’ Francis said suddenly. ‘I suppose Joyce will be there … Mabel Warren.’ Hateful to him, the thought of a party shared with those two. They were older than he. Joyce was eleven and Mabel Warren thirteen.