Transcription of 5 ElEctricity transmission - AER
1 5 ElEctricity transmissionElectricity generators are usually located close to fuel sources such as natural gas pipelines, coal mines and hydroelectric water reservoirs. Most ElEctricity customers, however, are located a long distance from these generators in cities, towns and regional communities. The ElEctricity supply chain, therefore, requires networks to transport power from generators to customers. The networks also enhance the reliability of ElEctricity supply by allowing a diverse range of generators to supply ElEctricity to end markets. In effect, the networks provide a mix of capacity that can be drawn on to help manage the risk of a power system Llewellyn (Corbis) Role of ElEctricity transmission networksTransmission networks transport ElEctricity from generators to distribution networks, which in turn transport ElEctricity to customers.
2 In a few cases, large businesses such as aluminium smelters are directly connected to the transmission network. A transmission network consists of towers and the wires that run between them, underground cables, transformers, switching equipment, reactive power devices, and monitoring and telecommunications equipment. 5 ElEctricity transmissionThis chapter considers:> the role of the ElEctricity transmission network sector> the structure of the sector, including industry participants and ownership changes over time> the economic regulation of the transmission network sector by the Australian Energy Regulator> revenues and rates of return in the transmission network sector> new investment in transmission networks> the operating and maintenance costs of running transmission networks> quality of service, including transmission reliability and the market impacts of of the matters canvassed in this chapter are addressed in more detail in the Australian Energy Regulator s annual report on the transmission oF tHE EnErGy marKEt 20091 AER.
3 transmission network service providers: ElEctricity performance report for 2007 08, Melbourne, must be converted to high voltages for efficient transport over long distances. This minimises the loss of electrical energy that naturally In Australia, transmission networks consist of equipment that transmits ElEctricity at or above 220 kilovolts (kV), along with assets that operate at 66 220 kV that are parallel to, and provide support to, the higher voltage transmission high voltage transmission network strengthens the performance of the ElEctricity industry in three ways:> F rst, it gives customers access to large, efficient generators that may be located hundreds of kilometres away.
4 Without transmission infrastructure, customers would have to rely on generators in their local area, which may be more expensive than remote generators.> Second, allowing many generators to compete in the ElEctricity market helps reduce the risk of market power.> Third, allowing ElEctricity to move instantaneously over long distances reduces the amount of spare generation capacity that must be provided at each town or city to ensure a reliable electrical supply. This reduces inefficient investment in Australia s ElEctricity transmission networksIn Australia, there are transmission networks in each state and territory, with cross border interconnectors that link some networks.
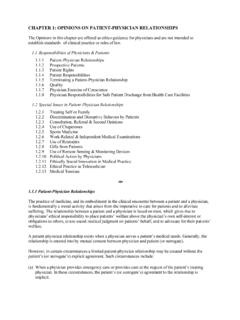
5 The National ElEctricity Market (NEM) in eastern and southern Australia provides a fully interconnected transmission network from Queensland through to New South Wales, the Australian Capital Territory (ACT), Victoria, South Australia and Tasmania (figure ). The transmission networks in Western Australia and the Northern Territory do not interconnect with the NEM or each other (see chapter 4).The NEM transmission network is unique in the developed world in terms of its long distances, low density and long, thin structure. It reflects the often long distances between demand centres and fuel sources for generation. The 290 kilometre link between Victoria and Tasmania, for example, is one of the longest submarine power cable in the world.
6 By contrast, transmission networks in the United States and many European countries tend to be meshed and of a higher density. These differences result in transmission charges being a more significant contributor to end prices in Australia than they are in many other countries for example, transmission charges comprise about 10 per cent of retail prices in the NEM3 compared with 4 per cent in the United can be transported over alternating current (AC) or direct current (DC) networks. Most of Australia s transmission network is AC, whereby the power flow over individual elements of the network cannot be directly controlled. Instead, electrical power (which is injected at one point and withdrawn at another) flows over all possible paths between the two points.
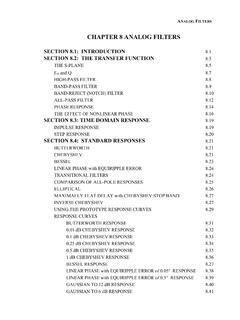
7 As a result, decisions on how much ElEctricity is produced or consumed at one point on the network can affect power flows in other parts of the network. Australia also has three DC networks, of which all are cross border . 2 . 1 Ow n e r s h i pTable lists Australia s transmission networks and their current ownership arrangements. Historically, government utilities ran the entire ElEctricity supply chain in all states and territories. In the 1990s governments began to separate the generation, transmission , distribution and retail segments into stand alone businesses. Generation and retail were opened up to competition, but this approach was not appropriate for the transmission and distribution networks, which became regulated chapter 5 ElEctricity transmission2 While transportation of ElEctricity over long distances is efficient at high voltages, there are risks, such as flashovers.
8 A flashover is a brief (seconds or less) instance of conduction between an energised object and the ground (or another energised object). The conduction consists of a momentary flow of ElEctricity between the objects, and is usually accompanied by a show of light and possibly a cracking or loud exploding noise. High towers, insulation and wide spacing between the conductors help to manage this The contribution of transmission to final retail prices varies across jurisdictions, customer types and Ofgem, Factsheet 66, London, January 2008 (available at ).Figure transmission networks in the National ElEctricity Market7G>H76C:B:A7 DJGC:86>GCHHN9C:N69:A6>9:=D76GI>ciZgXdcc ZXidgIgVchb^hh^dc cZildg`7 Vhha^c`FC>9^gZXia^c`=ZnlddYHcdln"K^XBjgg Vna^c`86C7.
9 GG6 QNI, Queensland New South Wales oF tHE EnErGy marKEt 2009 Table ElEctricity transmission networks in AustraliaNETWORKLOCATIONLINE LENGTH (KM) ElEctricity TRANSMITTED (GWh), 2007 08 MAXIMUM DEMAND (MW), 2007 08 ASSET BASE (2008 $ MILLION)1 INVESTMENT CURRENT PERIOD (2008 $ MILLION)2 CURRENT REGULATORY PERIODOWNERNEM REGION NETWORKSP owerlinkQld12 67148 5768 0823 9222 5281 July 2007 30 June 2012 Queensland GovernmentTransGridNSW12 48676 35912 9544 0642 4051 July 2009 30 June 2014 New South Wales GovernmentEnergyAustralia3 NSW88532 0075 6831 0131 1821 July 2009 30 June 2014 New South Wales GovernmentSP AusNetVic6 55351 9279 8502 23299041 Apr 2008 30 Mar 2014 Publicly listed company (Singapore Power International 51%)ElectraNetSA5 62013 7343 1721 2846501 July 2008 30 June 2013 Powerlink (Queensland Government)
10 , YTL Power Investment, Hastings Utilities TrustTransendTas3 65011 2982 3329366061 July 2009 30 June 2014 Tasmanian GovernmentNEM total41 865233 90142 07313 4518 292 INTERCONNECTORS5 DirectlinkQld NSW631801301 July 2005 30 June 2015 Energy Infrastructure Investments (Marubeni 50%, Osaka Gas 30%, APA Group 20%)MurraylinkVic SA1802201191 Oct 2003 30 June 2013 Energy Infrastructure Investments (Marubeni 50%, Osaka Gas 30%, APA Group 20%)BasslinkVic Tas3758456 UnregulatedPublicly listed CitySpring Infrastructure Trust (Temesek Holdings (Singapore) 28%)NON-NEM REGION NETWORKSW estern PowerWA6 79214 5003 42021357152871 July 2009 30 June 20128 Western Australian GovernmentPower and Water NT7301 July 2009 30 June 2014 Northern Territory Government1.