Transcription of 7. Basics of Turbulent Flow - mit.edu
1 1. 7. Basics of Turbulent Flow Whether a flow is laminar or Turbulent depends of the relative importance of fluid friction ( viscosity ) and flow inertia. The ratio of inertial to viscous forces is the Reynolds number. Given the characteristic velocity scale, U, and length scale, L, for a system, the Reynolds number is Re = UL/ , where is the kinematic viscosity of the fluid. For most surface water systems the characteristic length scale is the basin-scale. Because this scale is typically large (1 m to 100's km), most surface water systems are Turbulent . In contrast, the characteristic length scale for groundwater systems is the pore scale, which is typically quite small (< 1 mm), and groundwater flow is nearly always laminar.
2 The characteristic length-scale for a channel of width w and depth h is the hydraulic radius, Rh = wh/P, where P is the wetted perimeter. For an open channel P = (2h + w) and for a closed conduit P = 2(h+w). As a general rule, open channel flow is laminar if the Reynolds number defined by the hydraulic radius, Re = URh/ is less than 500. As the Reynolds number increases above this limit burst of Turbulent appear intermittently in the flow. As Re increases the frequency and duration of the Turbulent bursts also increases until Re > O(1000), at which point the turbulence is fully persistent. If the conduit boundary is rough, the transition to fully Turbulent flow can occur at lower Reynolds numbers.
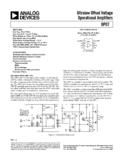
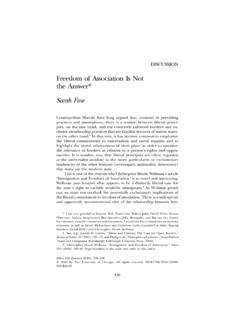
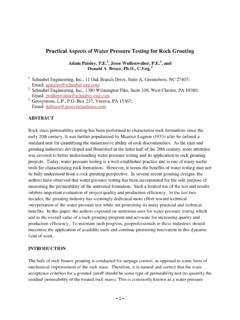
3 Alternatively, laminar conditions can persist to higher Reynolds numbers if the conduit is smooth and inlet conditions are carefully designed. Figure 1. Tracer transport in laminar and Turbulent flow. The straight, parallel black lines are streamlines, which are everywhere parallel to the mean flow. In laminar flow the fluid particles follow the streamlines exactly, as shown by the linear dye trace in the laminar region. In Turbulent flow eddies of many sizes are superimposed onto the mean flow. When dye enters the Turbulent region it traces a path dictated by both the mean flow (streamlines) and the eddies. Larger eddies carry the dye laterally across streamlines.
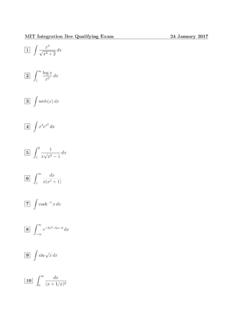
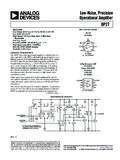
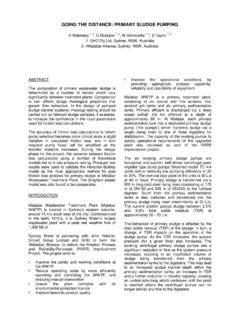
4 Smaller eddies create smaller scale stirring that causes the dye filament to spread (diffuse). 2. Characterizing Turbulence: Turbulent eddies create fluctuations in velocity. As an example, the longitudinal (u) and vertical (v) velocity measured at point A in figure 1 are shown below. Both velocities varying in time due to Turbulent fluctuations. If the flow were steady and laminar then u = u and v = v for all time t, where the over-bar denotes a time average. For Turbulent flow, however, the velocity record includes both a mean and a Turbulent component. We decompose the flow as follows. u (t) = u + u (t). (1). v (t) = v + v (t). mean Turbulent fluctuation This is commonly called a Reynolds' decomposition.
5 U'(t) = u(t) - u u u [cm/s]. v [cm/s] v=0. t [seconds]. Figure 2. Velocity recorded at Point A in Figure 1. Because the Turbulent motions associated with the eddies are approximately random, we can characterize them using statistical concepts. In theory the velocity record is continuous and the mean can be evaluated through integration. However, in practice the measured velocity records are a series of discrete points, ui. Below an overbar is used to denote a time average over the time interval t to t+T, where T is much longer than any turbulence time scale, but much shorter than the time-scale for mean flow unsteadiness, wave or tidal fluctuation. t+T. 1 N.
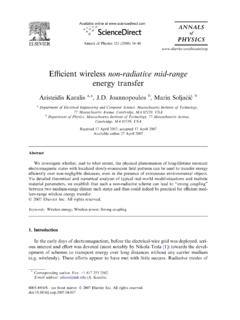
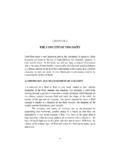
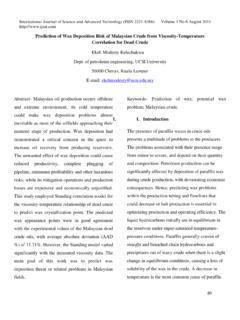
6 Mean velocity: u = u(t) dt =. N 1. ui (2). t continuous record discrete, equi-spaced pts. u ( t ) = u( t ) u : continuous record Turbulent Fluctuation: (3). u i = ui u : discrete points 1 N. ( u i ). 2. Turbulence Strength: u rms = u (t)2 = (4). N i =1. continuous record discrete, equi-spaced pts 3. Turbulence Intensity: urms/ u (5). The subscript rms' stands for root-mean-square. You should recognize the definition of urms given in (4) as the standard deviation of the set of random velocity fluctuations, u i . Similar definitions apply to the lateral and vertical velocities, v(t) and w(t). A larger urms indicates a higher level turbulence. In the figure below, both records have the same mean velocity, but the record on the left has a higher level of turbulence.
7 U [cm/s] U [cm/s]. urms U U. urms t [seconds] t [seconds]. Mean Velocity Profiles - Turbulent Boundary Layers: Near a solid boundary the flow has a distinct structure, called a boundary layer. The most important aspect of a boundary layer is that the velocity of the fluid goes to zero at the boundary. This is called the "no-slip" condition, the fluid velocity matches (has no slip relative to) the boundary velocity. This arises because of viscosity , , which is a fluid's resistance to flowing, fluid friction. The fluid literally sticks to the boundary. The higher its viscosity , the more a fluid resists flowing. Honey, for example, has a higher viscosity than water.
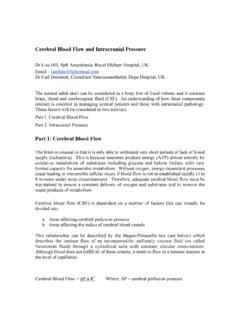
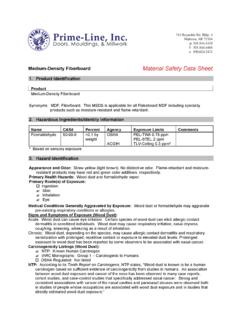
8 The kinematic viscosity of water is = cm2/s. The figure below depicts a typical mean velocity profile, u(y), above a solid boundary. The vertical axis (y). denotes the distance above the boundary. The fluid velocity at the boundary (y = 0) is zero. At some distance above the boundary the velocity reaches a constant value, U , called the free stream velocity. Between the bed and the free stream the velocity varies over the vertical coordinate. The spatial variation of velocity is called shear. The region of velocity shear near a boundary is called the momentum boundary layer. The height of the boundary layer, , is typically defined as the distance above the bed at which u = U.
9 4. Shear Produces Turbulence: Turbulence is an instability generated by shear. The stronger the shear, the stronger the turbulence. This is evident in profiles of turbulence strength (urms) within a boundary layer (see figure below). The shear in the boundary layer decreases moving away from the bed, ( u y) y < 0, and as a result the turbulence intensity also decreases. Very close to the bed, however, the turbulence intensity is diminished, reaching zero at the bed (y=0). This is because the no-slip condition applies to the Turbulent velocities as well as to the mean velocity. Thus, in a thin region very close to the bed, no turbulence is present. This region is called the laminar sub-layer, s.
10 Note that the profiles shown below are normalized by the free-stream velocity, U . This is done to emphasize the fact that the mean and Turbulent profiles within a boundary layer are self-similar with respect to the free stream velocity, U . This means that both profiles have the same shape regardless of the absolute magnitude of the external flow, U . Because of this self-similarity, we have the general rule of thumb that the turbulence level increases with the free stream velocity, urms ~ U , where the symbol ~ is read scales on . In addition, as the turbulence level increases, the thickness of the laminar sub-layer decreases. In general, s ~ (1/U ). y y.