Transcription of Appendix A: Excel, the Basics!
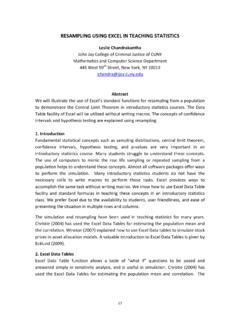
1 Appendix A: excel , the basics ! Note: This tutorial was originally written for excel 2003. There are a few additional instructions for the excel 2007 version. As it does not fit all versions of excel , see the excel help files or ask a lab instructor if you need additional help. We are going to walk through a few steps to practice (or learn) some important features in excel . We are going to: define some excel terminology learn how to enter data into a spreadsheet learn how to calculate mean and standard deviation from the data learn how to enter equations into a spreadsheet learn how to graph the data in the spreadsheet learn how to analyze the data based on the graph First, the terminology: When you create a new spread sheet in excel , a page will show up with a grid on it.
2 To the left of the grid, there are numbers designating which rows and to the top of the grid, there are capitol letters designating columns. Each box is referred to as a 'Cell' and we will consider the upper left cell to be the home cell. So, if you move 4 cells down and 3 cells to the right you would be in cell D5. Cell designations will be important when using equations. Entering data: The first task will be to type in some information. All you have to do for this is select a cell and start typing! A good thing to do first is to set up column headers.
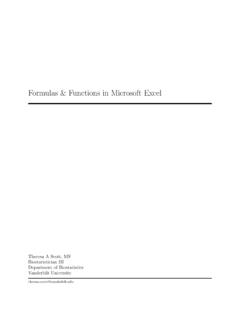
3 Simply go to cell 'A1' and type 'L1', cell 'B1' and type 'L2', cell C1 and type L2-L1. You can move between cells either by clicking on the new cell where you want to enter information, or by hitting the tab key or up/down/left/right arrows. Now it is time to enter some data. Type your measurements of l1 into one column, and l2 into the next column. Now, we want to calculate the difference between the two measurements, in order to calculate the length. excel will do this for you! Select cell C2. Type the following: =B2-A2 Notice that as you type B2 , cell B2 is highlighted, and as you type A2 , cell A2 is highlighted!
4 Also notice that as you type in the cell, the equation appears in the formula bar at the top. Now, hit enter, and the difference between the values in cells B2 and A2 will cell C2! Now, you want to calculate the difference for each of your pairs of measurements. You could repeat the method we just described, for every row of your data, a very tedious method, but excel does have way to speed up this process. The first step to unlock this secret is to select cell C2. Then hit control C on the keyboard to select this cell. (You are actually selecting the equation associated with the cell.)
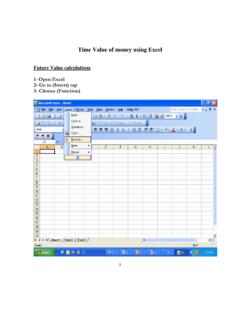
5 Now select cells C2 through C10 (or however many rows of data you have), and hit control V on the keyboard. You have just pasted the equation into all the rows! Each cell in column C now contains the difference between the corresponding rows in column B and column A! What about calculating the average (mean) and standard deviation? Do this by hand, with your calculator (you can do that at home). It is annoying and tedious, but we want you to do it .. just this once. The easier way is with excel , of course. Suppose you want to put the average value of your measured lengths in cell C11 (or whatever is your first empty cell in column C).
6 Select this cell. Now type this: =AVERAGE(C2:C10) and hit Enter. The average (mean) of cells C2 through C10 will appear in cell C11! (Another trick: instead of typing C2:C10 , you can select cells C2 through C10, and the cell numbers will automatically appear in your equation!) What about the standard deviation? Select the cell where you want the standard deviation to appear. Go up to the formula bar, and type: =STDEV(C2:C10) Now hit Enter, and the standard deviation of the numbers in cells C2 through C10 will appear! You may want to set up your data tables so that they display the correct number of significant digits.
7 To do this, select the cells you want to change. Right click on the selection, and choose Format Cells . Under the Number tab, choose number , and choose the number of decimal places you want to keep. Also, you can set up your table with borders. Again, select all the cells you want to put a border around. Right click in the selection, and choose the border tab. Click the outline and and inside buttons, then ok. Practice Creating a Graph (Using Pretend Data): Now, let s do something a bit more complicated. Let s enter some pretend data. Suppose a ball is rolling down an inclined plane.
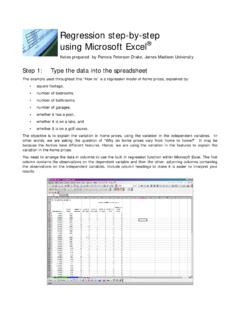
8 You measure its position at various different time points. Suppose you measure time from 0 seconds to 50 seconds, in increments of 1 second. Let s enter that data in column D. First, set up column headers. Go to cell D1 and enter Time . Go to cell E1 and enter Position . Go to cell F1 and enter Velocity . Go to cell G1 and enter Acceleration . There are 2 ways to enter the time data. The obvious one would be to go to cell 'D2' and type 0, then cell 'D3' and type 1, Again, a very tedious method, especially at the end of a long day when you want to go home!
9 Again, excel does have way to speed up things up. Enter 0 in 'D2' and 1 in 'D3'. Next highlight cells 'D2' and 'D3' (do this by clicking on one cell and dragging over to the other). Once you have selected the two cells, let go of the mouse buttons. You will notice in the lower right corner of cell 'B4' there is a small black square. Move the mouse over this square and you will notice that your cursor changes from a white thick plus sign to a black thin plus sign. Once the cursor changes to this black plus sign you can click and drag straight down about 50 cells.
10 You should notice to the right of the mouse a box with a number in it appears. This number represents the value that excel will enter into the cell for you. When you see that number reach 50, you can let go of the mouse and, like magic, all the cells will be filled with the values you would have otherwise had to type in yourself. This process is known as autofilling. Now, let s work with an equation. Just like what we did for the length data before, to enter an equation, you simply have to choose a cell and hit the '=' key. This tells excel that you want to use an equation in that cell.