Example: bankruptcy
Chapter 19 Split-Plot Designs - Purdue University
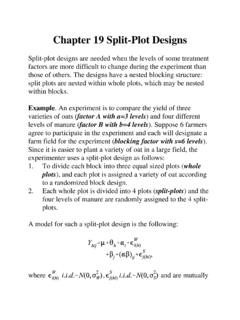
Chapter 19 Split-Plot Designs Split-plot designs are needed when the levels of some treatment factors are more difficult to change during the experiment than those of others. The designs have a nested blocking structure: split plots are nested within whole plots, which may be nested within blocks. Example . An experiment is to compare the yield ...
Tags:
Information
Domain:
Source:
Link to this page:
Documents from same domain
Chapter 19 Split-Plot Designs - Department of …
www.stat.purdue.eduChapter 19 Split-Plot Designs Split-plot designs are needed when the levels of some treatment factors are more difficult to change during the experiment than
Integre Technical Publishing Co., Inc. …
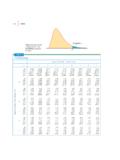
www.stat.purdue.eduTables • T-13 Table entry for p is the critical value F∗ with probability p lying to its right. F* Probability p TABLE E F critical values (continued) Degrees of …
Analysis of Repeated Measures - Purdue University
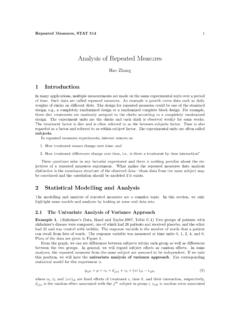
www.stat.purdue.eduRepeated Measures, STAT 514 1 Analysis of Repeated Measures Hao Zhang 1 Introduction In many applications, multiple measurements are made on the same experimental units over a period

Introduction to Genetic Association Studies
www.stat.purdue.eduTopic Introduction Introduction to Genetic Association Studies Cathryn M. Lewis and Jo Knight Genetic association studies are used to find candidate genes or genome regions that contribute to a
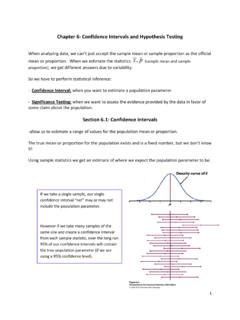
Chapter 6: Confidence Intervals and Hypothesis Testing
www.stat.purdue.eduState your conclusion about the data in a sentence, using the P‐value and/or comparing the P ‐value to a significance level for your evidence. STEP 1: State the null hypothesis H …
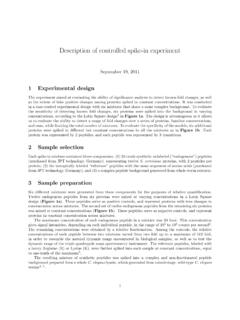
Description of controlled spike-in experiment
www.stat.purdue.eduDescription of controlled spike-in experiment September 19, 2011 1 Experimental design The experiment aimed at evaluating the ability of signi cance analysis to detect known fold changes, as well

CV with Publications
www.stat.purdue.eduCurriculum Vitae S.V.N. Vishwanathan Teaching Selected Graduate Courses 2015 Advanced Machine Learning 2014 { 2015 Analysis of Algorithms 2011 { 2014 Introduction to Computing for Statisticians

6 Finite Sample Theory of Order Statistics and Extremes
www.stat.purdue.edu6 Finite Sample Theory of Order Statistics and Extremes The ordered values of a sample of observations are called the order statistics of the sample, and the
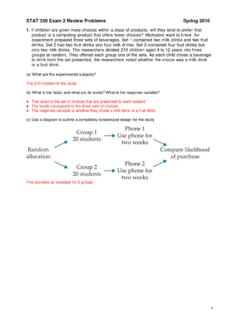
STAT 350 Exam 2 Review Problems Spring 2016
www.stat.purdue.eduSTAT 350 Exam 2 Review Problems Spring 2016 3 2. A random sample of 26 offshore oil workers took part in a simulated escape exercise, and their times (sec) to complete the escape are recorded. The sample mean is 370.69 sec and the sample standard deviation is 24.36 sec. Construct a 95% lower confidence bound on the true average escape time.

Mixed Models - Purdue University
www.stat.purdue.edu1 Introduction In many experimental design situations, one or more of the factors in the study may be random factors. That is, the levels of those factors are actually a sample from a larger population of levels and inferences are desired
Related documents

Design and Analysis of Experiments - University of Rajshahi
www.ru.ac.bdsplit-plot designs. The residual maximum likelihood method is now widely available in soft-ware and I have emphasized this technique throughout the book. Because there is expanding industrial interest in nested and split-plot designs, Chapters 13 and 14 have several new topics.
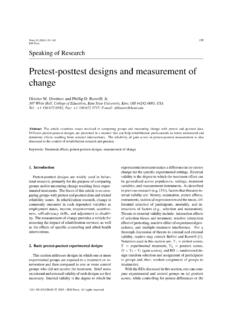
Pretest-posttest designs and measurement of change
cehd.gmu.eduDifferent pretest-posttest designs are presented in a manner that can help rehabilitation professionals to better understand and determine effects resulting from selected interventions. The reliability of gain scores in pretest-posttest measurement is also ... posttest data as a mixed (split-plot) factorial design with one between-subjects ...
Film & TV Production Roles and Departments
www.listeninglistening.comand flow of the film's plot, directing the performances of actors, selecting the locations in which the film ... A video split is used by directors to watch a monitor during each take. This is captured by special ... The illustrator creates visual representations of the designs to communicate the ideas imagined by the production designer. 6
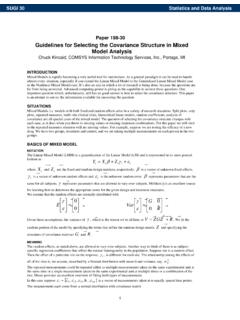
198-30: Guidelines for Selecting the Covariance Structure ...
support.sas.comThe CS structure is the well-known compound symmetry structure required for split-plot designs “in the old days”. As can be seen in the table, the variances are homogeneous. There is a correlation between two separate measurements, but it is assumed that the correlation is constant regardless of how far apart the measurements are. 2

Sample Size Calculation - University of North Dakota
med.und.eduSplit-Plot ANOVA Multiple Categories of Interest: Multi-Way ANOVA 1 Categorical: Proportion Test 1 Categorical + 1 Categorical Independent (non-paired): Fisher’s Exact Test Dependent (paired): McNamar’sTest 1 Categorical + 1+ Categorical Categorical groups≥2: Goodness-of-Fit Test 1 Numerical + 1 Numerical
The GC Column - Agilent
www.agilent.comPLOT Column Types • Agilent J&W PLOT columns begin with the designation of – GS (Gas Solid) or – HP-PLOT followed by a specific name – CP (ChromPack) followed by name – 10 stationary phases • GS-OxyPLOT / CP-Lowox • GS-Alumina • HP-PLOT Al 2 O 3 “M” • HP-PLOT Al 2 O 3 “S” • HP-PLOT Al 2 O 3 “KCl” / CP-AL 2 O 3 /KCl

Control and Field Instrumentation Documentation
www.isa.org7.1 Plot Plan It is often helpful to look at the plot plan to get an overview of how a plant is physically organized. By examining the plot plan, it is possible to get an idea of where a piece of equipment is located in the plant. A typical plot plan is shown in Figure 7-1. As will become clear in the following chapters, understanding the physi-

A First Course in Design and Analysis of Experiments
users.stat.umn.eduA First Course in Design and Analysis of Experiments Gary W. Oehlert University of Minnesota