Transcription of Chapter 8 - Electricity
1 1098 Electricity Introduction Electricity plays a significant role in the betterment of human life. Apart from its social benefits, Electricity is also a driving factor in the economy. Its usage ranges from communication and transportation to production. Local government plays an important role in the Electricity industry in South Africa. Schedule 4B of the Constitution lists Electricity and gas reticulation as a local government responsibility. Section 153 of the Constitution places the responsibility on municipalities to ensure the provision of services (which includes Electricity reticulation) to communities in a sustainable manner as well as promote economic and social development. Electricity is an important funding source for local government, particularly for larger urban municipalities.
2 Substantial investments are currently being made in the South African Electricity industry, together with the restructuring programme which is addressing the current emergency in Electricity supply. This Chapter gives an overview of: current and future developments in the Electricity supply industry the current composition of the Electricity distribution sector electrification and free basic Electricity municipal and municipal entity Electricity budgets factors influencing the efficient provision of the Electricity distribution function. Electricity plays a significant role in the betterment of human life Municipalities are required to provide Electricity reticulation services to their communities in a sustainable manner 2008 LOCAL GOVERNMENT BUDGETS AND EXPENDITURE REVIEW 110 Current and future developments in the Electricity supply industry Electricity provision consists of three phases namely, generation, transmission and distribution.
3 Generation is the process by which Electricity is produced; transmission is the transportation of Electricity that has been generated in power stations to local networks for distribution via high voltage, long distance power lines to the load centres and distribution is the actual delivery of Electricity to end consumers. Electricity generation and transmission together constitute Electricity supply and in South Africa this is largely the function of Eskom (in some cases, municipalities have their own generation capacity, but this is on a limited scale). The distribution function is shared between municipalities and Eskom. Current and future developments in generation Africa only produces a small percentage (3 per cent) of total world Electricity generated. South Africa generates around two-thirds of this amount, making it the largest supplier of Electricity on the African continent.
4 South Africa is particularly reliant on coal for Electricity generation, where close to 90 per cent of all Electricity in South Africa is generated using fossil energy/coal. This is because of South Africa s large deposits of coal, which provide a comparative advantage in coal production. And it is the main reason that the average selling price of Electricity has been one of the lowest in the world. Nevertheless, Eskom is currently exploring alternatives to the heavy reliance on coal for generating Electricity , including hydro power and nuclear energy. Of all the energy sources available for Electricity generation, burning coal is one of the most hazardous to the environment. It is estimated that coal-based Electricity generation accounts for 40 per cent of carbon dioxide emissions into the atmosphere.
5 In most countries, environmental taxes are usually applied directly on Electricity generation and to a lesser extent Electricity consumption and emissions. Several countries have implemented environmental taxes on Electricity , including several EU countries, India and Zambia. An Electricity levy to support energy efficiency was announced in the 2008 Budget Review. Government proposes to impose a 2 cent/kWh (kilowatt-hour) tax on the sale of Electricity generated from non-renewable sources by the producers/generators of Electricity , to be collected at source. This measure will serve the dual purpose of helping to manage the current supply shortages and protecting the environment. It is expected to raise about R4 billion annually. The introduction of this tax will be complemented by incentives that encourage firms to behave in a more environmentally responsible way.
6 Tax incentives to encourage the uptake and development of renewable energy, such as accelerated depreciation allowances, are already in place and could be developed further. Coal remains the biggest source for Electricity generation in South Africa Government has proposed a 2 cent/kWh tax on the sale of Electricity from non-renewable sources Chapter 8: Electricity 111 Trends in demand for Electricity Between 1970 and 2000, Electricity supply in South Africa exceeded Electricity demand, which led to the mothballing of several power stations in the late 1980s and early 1990s. These included three stations in Mpumalanga - Komati in Middelburg, Camden in Ermelo and Grootvlei in Balfour. They are currently being re-commissioned to meet the country s energy demands, which have been growing since 2000.
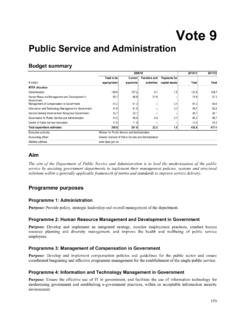
7 In the last few years the demand for Electricity has increased significantly. The positive economic growth that South Africa has experienced is undoubtedly one of the factors contributing to this increased demand. Figure compares the growth rate of South Africa s gross domestic product (GDP) with the growth in Eskom s sales (which is a good proxy for Electricity demand). There is a close correlation between overall growth in the economy and Eskom s total sales. Figure Real GDP growth versus Eskom sales (GWh) growth, December 1997 March 2007 -1%0%1%2%3%4%5%6%De c 9 7 De c 9 8 De c 99 Dec 00 Dec 01 Dec 0 2 De c 0 3 De c 0 4 Mar 06 Mar 07 Eskom total sales grow th (including exports)GDP grow th Source: Eskom, Annual Report, 2007 In determining energy demands/requirements, seasonal differences and daily peaks in Electricity usage need to be taken into account.
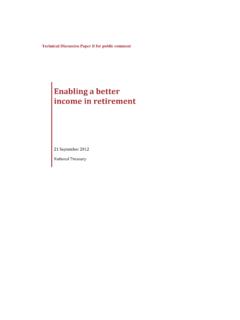
8 Figure shows that Electricity demand in South Africa varies over a 24-hour day, as well as in summer and winter. Between 7am and 5pm there is a constant demand for Electricity . The small dip at around 12pm to 1pm is probably due to the decreased use of equipment during lunchtime. Demand peaks at the end of the working day, between 6pm and 9pm, when Electricity consumption is at its maximum in the form of lighting, stoves and television. In terms of seasons, there is an approximate increase of 2000MW in usage in the winter months between June and August. Electricity demand/usage increases with economic activity 2008 LOCAL GOVERNMENT BUDGETS AND EXPENDITURE REVIEW 112 Figure Electricity demand patterns 21232527293133353702:00 04:00 06:00 08:00 10:00 12:00 14:00 16:00 18:00 20:00 22:00 24:00MW in thousandsTypical w inter dayTypical summer dayPeak day 29 June 2006 Source: Eskom, Annual Report, 2007 South Africa s estimated existing capacity is around 43 000MW, with maximum demand peaking at 38 000MW.
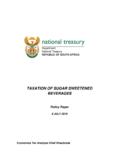
9 In the last few years, maximum demand for Electricity has tended to be just below maximum capacity, which led to the supply constraints experienced in 2007 and a critical shortage of supply in 2008. Figure illustrates Eskom s generation plant capacity and maximum demand over the last decade. Figure Generation plant capacity and maximum demand, December 1997 March 2007 051015202530354045 Dec 97 Dec 98 Dec 99 Dec 00 Dec 01 Dec 02 Dec 03 Dec 04 Mar 06 Mar 07MW in thousandsNe t ma x imu m c a p a c it yCapacity in reserve storageMa x imu m d e ma n d Source: Eskom, Annual Report, 2007 When it comes to managing Electricity capacity challenges, South Africa can learn from experiences elsewhere. For example, Brazil presents a major success story of controlling Electricity demand.
10 When the country suffered serious droughts in 2001, hydropower generation capacity fell. The Brazilian government initiated demand management strategies, which included a successful Electricity rationing programme that was driven by incentives for Electricity saving and Chapter 8: Electricity 113penalties for excessive use. This system, implemented in conjunction with a number of other structural and legal reforms, facilitated a positive response from consumers, resulting in a decrease in Electricity demand. Since the proposed reforms, Brazilian Electricity demand has remained constant at a lower level. Government s response to the current situation Government has recognised that a multi-pronged approach is required to address the current situation. Priority will be given not only to the building of new power generation capacity (through Eskom and independent power producers (IPPs)), but also to finding effective demand side management strategies.