Transcription of Crystallite Size Measurement Using X-ray Diffraction
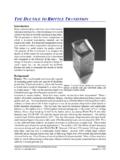
1 Department of Chemical Engineering and Materials ScienceMike MeierUniversity of California, DavisSeptember 13, 2004 Figure 1. FEG-SEM image of nanosized aluminum oxide powder . Note themagnification and the size of the micron bar. Also note how the smaller particlesand the edges of the larger particles appear to be somewhat transparent. This isbecause much of the 5 kV electron beam can pass through these thinner parts of size Measurement Using X-ray Diffraction IntroductionPhase identification Using X-ray Diffraction relies mainly on the positions of the peaks in a diffractionprofile and to some extent on the relative intensities of these peaks.
2 The shapes of the peaks,however, contain additional and often valuable information. The shape, particularly the width, ofthe peak is a measure of the amplitude of thermal oscillations of the atoms at their regular latticesites. It can also be a measure of vacancy and impurity element concentrations and even plasticdeformation, any factor which results in a distribution of d-spacings. Crystallite size can also cause peak broadening. The well known Scherrer equation explains peakbroadening in terms of incident beam divergence which makes it possible to satisfy the Braggcondition for non-adjacent Diffraction planes.
3 Once instrument effects have been excluded, thecrystallite size is easily calculated as a function of peak width (specified as the full width at halfmaximum peak intensity (FWHM)), peak position and wavelength. Warren and Averbach s methodtakes not only the peak width into account but also the shape of the peak. This method is based ona Fourier deconvolution of the measured peaks and the instrument broadening to obtain the truediffraction profile. This method is capable of yielding both the Crystallite size distribution andlattice microstrain. The Scherrer and the Warren-Averbach methods do not give the same value for the Crystallite is because they each yield different characteristic averages from the Crystallite size by combining the results of the Scherrer and the Warren-Averbach methods and makingreasonable assumptions regarding Crystallite shape and size distribution it is possible to arrive at asingle size this experiment both the Scherrer and the Warren-Averbach methods are used to measure thecrystallite size in several fine, even nano-crystalline, powders.
4 Coarser powders, larger than 1micron, may be analyzed to illustrate the limitations of these Characteristic AveragesIn any distribution there are a number of characteristic averages. The ones we need here are thearithmetic meanthe area-weighted averageand the volume-weighted average2. Scherrer Crystallite SizeThe Crystallite size as measured by the Scherrer method is given bywhere <L>vol is the volume-weighted size , 2B is the Bragg angle, 8 is the wavelength of the x-rayand K is a unit cell geometry dependent constant whose value is typically between and is the full-width-half-max of the peak after correcting for peak broadening which is caused bythe diffractometer.
5 One way to represent B iswhere Bobs is the measured peak width and Bm is the beak broadening due to the machine. 3. The Method of Warren-AverbachThe Warren-Averbach method is based on a Fourier analysis of the Diffraction peak. The measuredpeak profile h(s) is actually the convolution of a function for the pure peak profile f(s) and a functionfor the instrumental broadening g(s)where s/(2sin2)/8. This can also be represented by the product of the Fourier transforms forinstrumental broadening (g) and the pure peak profile (f) The Warren-Averbach method involves Using (g) obtained from the analysis of a line-widthstandard such as LaB6 to solve for (f) and then performing an inverse Fourier transform on (f)to obtain f(s).
6 The result can be written as a Fourier serieswhere A(L) and B(L) are the cosine and sine coefficients and L is the length of a column of unit cellsperpendicular to the diffracting planes. A plot of A(L) versus L is used to determine the areaweighted Crystallite size <L>area and lattice microstrain. If two peaks in the same family of planesare used in this analysis then the contribution of microstrain to peak broadening can be Crystallite SizeThe Scherrer and Warren-Averbach methods yield different characteristic averages of the columnlength L. The Scherrer method yields <L>vol while Warren-Averbach yields <L>area.
7 In order toobtain a measure of the Crystallite size one may assume a shape for the particles. Assumingspherical crystallites the diameter of the sphere can be estimatedand5. Crystallite size DistributionSize distributions tend to be log-normal, a distribution where there are a relatively large number ofsmaller particles. The normalized log-normal distribution is given bywhere D0 is the median value and F is the width of the distribution. The characteristic averagesdefined in part 1 are given byBy doing both the Scherrer and Warren-Averbach analyses and assuming spherical particles we willhave both <D>area and <D>vol.
8 This allows us to solve for D0 and F, calculate <D>num, and plot thecomplete Crystallite size Relative Intensity104 105 106 107 108 109 110 111 112 2-Theta, degreesFigure 2. Profile fitting of two of the peaks from the anatase ExampleThe following example shows the results of the Crystallite size analysis of a powder containinganatase and rutile. The analysis concentrated on the anatase phase. Figure 2 shows two peaks used in this results from this peak and from two others are summarized in table 1. These results show thatthe Scherrer size is consistently larger than the Warren-Averbach size which was expected given thedifferences in the volume and area-weighted averages.
9 It also shows a trend in size versusdiffraction angle which is especially pronounced for the Scherrer analysis, something that was notexpected and initially concerned 1. Results of the particle size analyses of a TiO2 Sizes(Spherical)Log-NormalDistributionAv erageSize2-ThetaReflection<L>Vol<L>Area<D>Vol<D>AreaFDo<D>Numdegrees(hkl) (200) (316) (400) The final size distribution and the characteristic averages are shown in figure 3.
10 Notice howdifferences in the area and volume weighted averages for each peak turn out to be insignificant oncethe whole distributions are plotted and single objective of this experiment is to measure the Crystallite size distribution in the specimensprovided. The results from the Scherrer analysis are useful in obtaining a final result from size , nm<D>vol<D>area<D>numMedian(200)(316)(400)Figure 3. The final log-normal distributions based on the analysis of three leaks in the anatase method. The results of the Warren-Averbach analysis in combination with theScherrer Crystallite size will be used to produce a plot of the Crystallite size powders will be available.