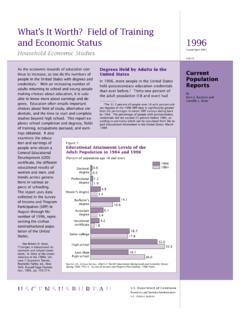
Transcription of Current Population Reports - Census.gov
1 Living Longer: Historical and Projected Life Expectancy in the United States, 1960 to 2060 Population Estimates and ProjectionsBy Lauren Medina, Shannon Sabo, and Jonathan VespaCurrent Population ReportsIssued February 2020P25-1145 INTRODUCTIONOver the last four decades, life expectancy in the United States has largely risen, although certain groups have experienced slight decreases in their life expectancy, gaining the attention of mortality experts and the media. Recent headlines draw attention to the role of the opioid epidemic in this unusual downturn in life expectancy among non-Hispanic White adults.
2 In considering what the future of the Population may look like, we must address historical and recent shifts in life expectancy and understand that these shifts are the result of complex social, cultural, bio-logical, and economic forces. Looking forward, we seek to uncover how life expectancy might change in coming decades and assess how these changes might look across the various race, ethnic, and nativity groups that make up the Population . Throughout this report, we use the census Bureau s 2017 National Population Projections to examine potential mortality and life expectancy changes in the coming decades.
3 To provide historical context, we draw extensively on life expectancy data from the National Center for Health Statistics (NCHS). The report includes projections of life expectancy from 2017 to 2060 and explores projected differences in mortality for men and women and for different race and Hispanic origin groups in the United States. The report also focuses on projected life expectancy dif-ferences between the native-born and foreign-born populations. The mortality projections covered in this report are based on the first nativity-specific life tables and life expectancies to be published by the census of life expectancy can provide essential information on Population aging, guide the future of public health, and gauge potential impacts on health care systems.
4 As a result, they can help improve our understanding of social welfare and bet-ter inform policy planning. In addition to presenting mortality patterns for the total Population , depict-ing life expectancy patterns by characteristics, such as sex, race, Hispanic origin, and nativity, provides a more accurate story of Current and future Population health within the United HIGHLIGHTS Americans are projected to have longer life expec-tancies in coming decades. By 2060, life expec-tancy for the total Population is projected to increase by about six years, from in 2017 to in Increases in life expectancy are projected to be larger for men than women, although women are still projected to live longer than men do, on aver-age, in 2060.
5 All racial and ethnic groups are projected to have longer life expectancies in coming decades, but the greatest gains will be to native-born men who are non-Hispanic Black alone and non-Hispanic 1 The census Bureau reviewed this data product for unauthorized disclosure of confidential information and approved the disclosure avoidance practices applied to this release. CBDRB-FY19-245. 2 Official life expectancy measures from the NCHS were lower than the projected life expectancy values for 2017. Despite recently observed decreases in life expectancy, these projections assume continued increases in life census BureauAmerican Indian or Alaska Native alone.
6 Among the native-born popula-tion, Hispanic women had the longest life expectancy, years, of any race or Hispanic origin group in the United States in 2017. They are pro-jected to continue to have the longest life expectancy, years, in 2060. In 2060, foreign-born men and women are projected to con-tinue having longer life expec-tancies than their native-born peers, regardless of race or Hispanic MORTALITY BY NATIVITY, RACE, AND HISPANIC ORIGINN ativity is a demographic characteristic that iden-tifies if an individual is native-born or foreign-born.
7 The census Bureau uses the following defini-tions for nativity status:Native-born, or native-born Population : anyone who is a citizen at birth, including people born in the United States, Puerto Rico, a Island Area (Guam, the Commonwealth of the Northern Mariana Islands, and the Virgin Islands), or born abroad to a citizen parent or , or foreign-born Population : anyone who is not a citizen at birth, which includes noncitizen nationals, naturalized citizens, lawful permanent residents (immigrants), tempo-rary migrants (such as foreign students), humani-tarian migrants (such as refugees and asylees)
8 , and unauthorized the purposes of the 2017 National Population Projections, those born in the United States or in territories are considered native-born while those born elsewhere are considered of the innovations in the 2017 National Population Projections series was the inclusion of nativity as a characteristic in the mortality mea-sures. Similar to projecting mortality by sex, race, and Hispanic origin, projecting mortality rates by nativity requires additional information from administrative records, specifically, about the place of birth of the deceased.
9 This addition improves the Population projections by accounting for the different mortality patterns of the native-born and 2017 National Population Projections use historical vital statistics data to inform projected mortality rates by sex, nativity, race, and Hispanic origin. The denominators of the mortality rates contain bridged Population estimates to main-tain continuity with race and Hispanic origin classifications of vital records over time. Because Current Population estimates adhere to revised 1997 Office of Management and Budget (OMB) standards for race and ethnicity, which allow for the reporting of more than one race, estimates for multiple-race people must be bridged back to single-race categories in accordance with 1977 OMB standards to ensure historical continuity.
10 Furthermore, due to concerns about the quality of race reporting in death data over the time series, non-Hispanic race groups with similar mortality patterns were collapsed into two As a result, mortality rates were produced for three race and Hispanic origin groups for the projected data: Group 1: Non-Hispanic White alone, non-Hispanic Asian alone, and non-Hispanic Native Hawaiian or Other Pacific Islander alone. Group 2: Non-Hispanic Black or African American2 alone and non-Hispanic American Indian or Alaska Native alone. Group 3: Hispanic or Latino3 (of any race).