Transcription of Current Population Reports - Census.gov
1 Living Longer: Historical and Projected Life Expectancy in the United States, 1960 to 2060 Population Estimates and ProjectionsBy Lauren Medina, Shannon Sabo, and Jonathan VespaCurrent Population ReportsIssued February 2020P25-1145 INTRODUCTIONOver the last four decades, life expectancy in the United States has largely risen, although certain groups have experienced slight decreases in their life expectancy, gaining the attention of mortality experts and the media. Recent headlines draw attention to the role of the opioid epidemic in this unusual downturn in life expectancy among non-Hispanic White adults. In considering what the future of the Population may look like, we must address historical and recent shifts in life expectancy and understand that these shifts are the result of complex social, cultural, bio-logical, and economic forces. Looking forward, we seek to uncover how life expectancy might change in coming decades and assess how these changes might look across the various race, ethnic, and nativity groups that make up the Population .
2 Throughout this report, we use the census Bureau s 2017 National Population Projections to examine potential mortality and life expectancy changes in the coming decades. To provide historical context, we draw extensively on life expectancy data from the National Center for Health Statistics (NCHS). The report includes projections of life expectancy from 2017 to 2060 and explores projected differences in mortality for men and women and for different race and Hispanic origin groups in the United States. The report also focuses on projected life expectancy dif-ferences between the native-born and foreign-born populations. The mortality projections covered in this report are based on the first nativity-specific life tables and life expectancies to be published by the census of life expectancy can provide essential information on Population aging, guide the future of public health, and gauge potential impacts on health care systems. As a result, they can help improve our understanding of social welfare and bet-ter inform policy planning.
3 In addition to presenting mortality patterns for the total Population , depict-ing life expectancy patterns by characteristics, such as sex, race, Hispanic origin, and nativity, provides a more accurate story of Current and future Population health within the United HIGHLIGHTS Americans are projected to have longer life expec-tancies in coming decades. By 2060, life expec-tancy for the total Population is projected to increase by about six years, from in 2017 to in Increases in life expectancy are projected to be larger for men than women, although women are still projected to live longer than men do, on aver-age, in 2060. All racial and ethnic groups are projected to have longer life expectancies in coming decades, but the greatest gains will be to native-born men who are non-Hispanic Black alone and non-Hispanic 1 The census Bureau reviewed this data product for unauthorized disclosure of confidential information and approved the disclosure avoidance practices applied to this release.
4 CBDRB-FY19-245. 2 Official life expectancy measures from the NCHS were lower than the projected life expectancy values for 2017. Despite recently observed decreases in life expectancy, these projections assume continued increases in life census BureauAmerican Indian or Alaska Native alone. Among the native-born popula-tion, Hispanic women had the longest life expectancy, years, of any race or Hispanic origin group in the United States in 2017. They are pro-jected to continue to have the longest life expectancy, years, in 2060. In 2060, foreign-born men and women are projected to con-tinue having longer life expec-tancies than their native-born peers, regardless of race or Hispanic MORTALITY BY NATIVITY, RACE, AND HISPANIC ORIGINN ativity is a demographic characteristic that iden-tifies if an individual is native-born or foreign-born. The census Bureau uses the following defini-tions for nativity status:Native-born, or native-born Population : anyone who is a citizen at birth, including people born in the United States, Puerto Rico, a Island Area (Guam, the Commonwealth of the Northern Mariana Islands, and the Virgin Islands), or born abroad to a citizen parent or , or foreign-born Population : anyone who is not a citizen at birth, which includes noncitizen nationals, naturalized citizens, lawful permanent residents (immigrants), tempo-rary migrants (such as foreign students), humani-tarian migrants (such as refugees and asylees), and unauthorized the purposes of the 2017 National Population Projections, those born in the United States or in territories are considered native-born while those born elsewhere are considered of the innovations in the 2017 National Population Projections series was the inclusion of nativity as a characteristic in the mortality mea-sures.
5 Similar to projecting mortality by sex, race, and Hispanic origin, projecting mortality rates by nativity requires additional information from administrative records, specifically, about the place of birth of the deceased. This addition improves the Population projections by accounting for the different mortality patterns of the native-born and 2017 National Population Projections use historical vital statistics data to inform projected mortality rates by sex, nativity, race, and Hispanic origin. The denominators of the mortality rates contain bridged Population estimates to main-tain continuity with race and Hispanic origin classifications of vital records over time. Because Current Population estimates adhere to revised 1997 Office of Management and Budget (OMB) standards for race and ethnicity, which allow for the reporting of more than one race, estimates for multiple-race people must be bridged back to single-race categories in accordance with 1977 OMB standards to ensure historical continuity.
6 Furthermore, due to concerns about the quality of race reporting in death data over the time series, non-Hispanic race groups with similar mortality patterns were collapsed into two As a result, mortality rates were produced for three race and Hispanic origin groups for the projected data: Group 1: Non-Hispanic White alone, non-Hispanic Asian alone, and non-Hispanic Native Hawaiian or Other Pacific Islander alone. Group 2: Non-Hispanic Black or African American2 alone and non-Hispanic American Indian or Alaska Native alone. Group 3: Hispanic or Latino3 (of any race). Throughout this report, projected mortality trends by race and ethnicity will be based on these group-ings. When observed or historical National Center for Health Statistics data and other citations are used, these groupings do not : For more information on how mortality projections were calculated in the 2017 National Population Projections, please see the full projections methodology statement at < /popproj/technical-documentation/methodology >.
7 1 Although non-Hispanic American Indian or Alaska Native alone deaths tend to be misclassified more often than any other race and ethnic group (Arias, Heron, and Hakes, 2016), no adjust-ments are made to the death data to specifically account for Throughout this report, Black and Black or African American may be used Throughout this report, Hispanic and Hispanic or Latino may be used census Bureau 3 HISTORICAL AND PROJECTED GAINS TO LIFE EXPECTANCY Although life expectancy continues to rise, increases have slowed in recent report provides a unique opportunity to analyze changes in life expectancy over the 100-year period from 1960 to 2060. The trends from 1960 to 2014 reflect changes that have actually hap-pened (observed) and are drawn from NCHS Reports . The trends from 2015 to 2060 are projected, given Current patterns in mor-tality illustrated in the census Bureau s 2017 National Population Projections. While we report the overall changes in life expectancy from 1960 to 2060 as one period, it is important to distinguish between what has already hap-pened and what is projected to happen in the future.
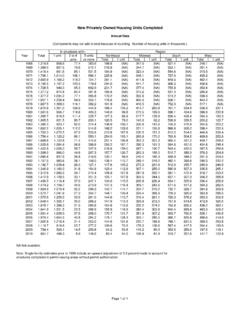
8 In the graphs, we denote the observed and projected portions of the trends. Between 1960 and 2015, life expectancy for the total popula-tion in the United States increased by almost 10 years from years in 1960 to years in 2015. Looking ahead, gains to total life expectancy are projected to increase only years from 2016 to 2060 (Figure 1). By 2060, total life expectancy in the United States is projected to reach an all-time high of years. Since 1960, the largest gains in life expectancy occurred between 1970 and 1980 an increase of about three years from to years. Such a large increase in a relatively short period is attrib-uted to increases in vaccinations, continued decreases in infec-tious diseases and cardiovascular mortality, and the effectiveness of prevention programs related to smoking, alcohol consumption, and promotion of physical activity (Hinman et al., 2011; Klenk et al., 2016). The rise in life expectancy has not been continuous or universal. Data from NCHS (Arias and Xu, 2019) show that in 2015, the total Population saw its first decrease in life expectancy (by years) since 1993.
9 These data also show slight declines occurring among the non-Hispanic White alone, Figure Historical and Projected Life Expectancy for the Total U S Population at Birth YearLife expectancy at age (in years)Sources U S census Bureau National Population Projections and National Center for Health Statistics Life Tables www cdc gov nchs data nvsr nvsr nvsr - pdf ProjectedFemaleTotalMale4 census Bureaunon-Hispanic Black alone, and Hispanic populations through 2017. Despite these continued and slight declines, the life expec-tancy of non-Hispanic Black alone females has remained relatively stable. For more information on recent drivers of mortality, see the Causes of Mortality text large gains to life expec-tancy in the latter part of the twentieth century, increases in recent years have stagnated and are projected to continue ris-ing more slowly through 2060. Between 1970 and 2015, life expectancy rose by years (Arias and Xu, 2019). It is pro-jected to increase by nearly 6 years between 2017 and 2060.
10 Despite the recent decline for non-Hispanic Whites between 2015 and 2017 reflected in NCHS data, we project that life expec-tancy will rise in coming decades, although more slowly than it has in the past. The last two decades show broad increases in life expectancy, a pattern that we expect outweighs the recent and small declines for certain race groups. Historically, this has been the case when a particular cause of death like influenza epidem-ics in 1968 and 1980 is associ-ated with a short-term decline in life expectancy (NCHS, 1981). CAUSES OF MORTALITYA lthough life expectancy rose steadily in the latter part of the twentieth century, we project slower increases in coming decades, reflective of the stagnation in gains after 2010. Slower gains to life expectancy may have resulted from stalled progress in treating the leading causes of death and other degenerative diseases. Moreover, the prevalence of preventable health risks such as smoking, obesity, and, more recently, opioid-related overdoses hinders overall Population health and contributes to slowed gains in life expectancy.