Transcription of Development of Stress-Strain Polynomials for ACCC/TW Drake
1 February 26, 2007. COMPOSITE TECHNOLOGY CORPORATION. Development of Stress-Strain Polynomials and Creep Parameters for ACCC/TW Conductors PROJECT NUMBER: 111322. PROJECT CONTACT: Peter Catchpole Project Manager EMAIL: PHONE: 208-788-3456. FAX: 208-788-2082. Development of Stress-Strain Polynomials and Creep Parameters for ACCC/TW Conductors POWER Engineers, Inc February 2007. Table of Contents Introduction .. 1. Development of Stress-Strain 1. Background .. 1. Test Data 2. Polynomial Development .. 2. Creep 5. Final Modulus of Elasticity.
2 6. Proposed Sag-Tension File 6. PLS-CADD Sag-Tension 7. SAG10 Sag-Tension Characteristics .. 10. Appendices Appendix A Kinectrics Load- strain Test Data Plots, Figures A1 through A6, a) and b). Appendix B Excel Files (8) for Polynomial Development (CD). Appendix C Proposed Polynomials et al PDF Images of PLS-CADD Wire File Edit Windows (US and SI units). PLS-CADD [*.wir] files on CD. PDF Images of Alcoa SAG10 Wire File Edit Windows (US units). HLY 009-085 (02/26/07) 111322/lk i 2/26/2007. Development of Stress-Strain Polynomials and Creep Parameters for ACCC/TW Conductors Introduction This report describes the process used to develop new Stress-Strain Polynomials and related values for Composite Technologies Corporation's (CTC) ACCC/TW .
3 Conductors for use in the sag-tension programs PLS-CADD and Alcoa's SAG10. CTC has published values for the conductors. Theses current values are revised for the reasons explained and proposed values are offered in replacement. Development of Stress-Strain Polynomials Background The Stress-Strain (S-S) relationship of a conductor that is constructed with two parts a core and aluminum strands wrapped helically in layers around it is developed via a standard test procedure described in A Method for S-S Testing of Aluminum conductor and ASCR and a Test Method for Determining the Long Term Tensile Creep of Aluminum Conductors in Overhead Lines , prepared by the Technical Committee of the Aluminum Association, 1964 and 1971.
4 The phrase Stress-Strain is a misnomer in that the tests are conducted in load- strain units and the plots in the sag-tension programs use the same load- strain units. In the standard procedure, two standardized load- strain tests are conducted one on the conductor and a second on the core of the conductor . It is not physically possible to test the aluminum portion of the conductor in isolation so the characteristics of the aluminum portion of a conductor are developed by the subtraction of the core load from the whole conductor load at common strains.
5 By this means, three polynomial load- strain curves are created: whole conductor (C), core (B) and aluminum (A). As noted, the first two are developed directly, while the third is calculated from them. ie: A = C B. In sag-tension programs such as PLS-CADD and SAG10 (Alcoa), the core (B). and aluminum (A) curves are defined by fourth-order polynomial equations and the whole conductor curve is calculated from them by their addition of one to the other. ie: C = A + B. CTC obtained load- strain test data from single tests on six of their conductors.
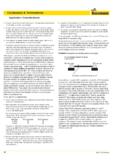
6 Graphical plots of these test results are provided in Appendix A: Kinectrics Load- strain Test Data; Figures B1 through B7 a) and b). The test results identify seven coordinates (targets) through which the curves should pass one target at the origin and three each on the conductor and core curves. HLY 009-085 (02/26/07) 111322/lk 1 2/26/2007. Test Data Correction The figures in Appendix A are taken directly from the Kinectrics test reports. On each of the (a) conductor plots, we have drawn a few lines near the origin of the plot.
7 The line of importance is an estimate of where the conductor data origin would be if the concave shape of the plot near the origin were removed. The concave shape is not a feature of a long span's load- strain relationship. It is unique to test data made with a fairly short length of wire. It is normal to remove the concave shape. This concave shape removal was done by shifting the load and strain values for the target points downward by calculated1 amounts. Of the six ACCC/TW . conductors, most had significant concave plots at low loads-strains.
8 It is present in all plots except for the Linnet and Bittern conductors. It is modest in the Drake plot. The source of the concave shape is debatable but no doubt sourced in the conductor manufacturing process. If it is found to be present in future tests, the manufacturing process might need adjustment to seek its removal. It is useful to note that all indications point to the fact that test data are not an exact representation of fact. There is some dispersion to conductor characteristics and some dispersion to the measurement of it.
9 There is also dispersion to the calculations used to predict and understand it. This is evident in the data itself, in attempts to model it with our mathematical tools and in conversations with persons who deal with the subject matter on a daily basis. As a result, it is necessary that the reader understand the following: It is the mark of an instructed mind to rest satisfied with the degree of precision which the nature of the subject admits and not to seek exactness when only an approximation of the truth is possible Aristotle BC 384-322.
10 With that in mind, understand that the changes we are proposing to the polynomial values have less to do with rendering results more accurate than they have to do with basing the values on correct principles. Polynomial Development Our polynomial Development work was done in EXCEL files [S-S Curves- ]. These files are attached on CD as Appendix B. Figure 1, taken from the file illustrates two sets of polynomial curves for the whole conductor (red), aluminum (blue) and the core (black). The thin-line set is the current Polynomials published by CTC, using the values in Table 1 and the thick- lines are the new polynomial set using the values in Table 2.