Transcription of dragging in the original spreadsheet using the mouse ...
1 LINEST in ExcelThe excel spreadsheet function "linest" is a complete linear least squares curve fitting routinethat produces uncertainty estimates for the fit values. There are two ways to access the "linest"functionality; through the function directly and through the "analysis tools" set of macros. Theseinstructions cover using "linest" as a spreadsheet linest in your spreadsheets is very easy, after you master the concept of an array functions are functions that while entered into a single spreadsheet cell produce results thatfill several cells. The steps outlined below take you set-by-step through the process of linearcurve 1. Type in your data in two columns, onefor the x variables and one for the y. You canuse any labels you would like. "x" and "y" areused in the example at right for 2. Select the area that will hold the outputof the array formula. For "linest" you shoulddrag to form a 5 row by 2 column data 3.
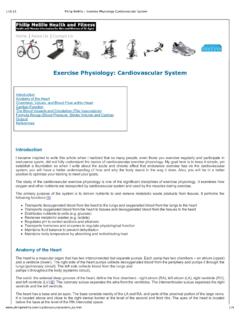
2 Click in the formula bar at the top of the screen. Now press the function wizard button is in the formula bar and is labeled "fx". A two-part scroll box will appear; in the leftscroll box click on "Statistical" and in the right click on "LINEST". Next click on "Next>." Thewindow shown below will appear. On your spreadsheet select the cells containing the y values bydragging in the original spreadsheet using themouse. Click in the "known_x's" dialog box, andselect the cells containg the x values. Type in "TRUE" in the last two dialog boxes. The firstTRUE indicates that you wish the line to be in the form y=mx+b with a non-zero intercept. Thesecond TRUE specifies that you wish the error estimates to be listed. The Function Wizarddialog box should then appear as 4. Click on "Finish." The formula bar should then appear as below, although your y and xcell ranges may be different, of course. If the values are incorrect, you can edit them as youwould here is the important step.
3 LINEST is an array function, which means that whenyou enter the formula in one cell, multiple cells will be used for the output of the function. Tospecify that LINEST is an array function do the following. Highlight the entire formula,including the "=" sign, as shown above. On the Macintosh, next, hold down the apple key andpress "return." On the PChold down the Ctrl and Shift keys and press Enter. excel adds "{}" brackets around the formula, to show that it isan array. Note that you cannot type in the "{ }"characters yourself; if you do excel will treat the cell contents as characters and not a the full formula and typing the apple key or Ctrl + Shift and "return" is theonly way to enter an array least squares results should be printed as shown below. The labels in the first and lastcolumn aren't provided by the LINEST function. We've added them to show the meaning of eachcell. For example, the slope is and the intercept is intercept s(y) of freedomregression residual ssStep 6: You should now evaluate the model that you have built.
4 The r2value is often used for thispurpose, but it is only a rough indicator of the goodness of fit. The r2value is calculated from thetotal sum of squares, which is the sum of the squared deviations of the original data from themean:total ss = i=1n(yi-yav)2)and the regression sum of squares, which is thesum of the squared deviations of the fit valuesfrom the mean:regression ss = i=1n(y^i-yav)2 Giving:r2=regression sstotal ss= (y^-yav)2 (yi-yav)2 Values close to one are good. The uncertainties in the slope and intercept are much better forjudging the quality of the fit. In the example the uncertainty in the slope is *100 = 3%and the uncertainty in the intercept is 12%, which is only about two significant figures in uncertainties in the slope and intercept are not as good as the r2of might haveindicated! An even better statistical test of the goodness of fit is to use the Fisher F-statistic. TheF-statistic is the ratio of the variance in the data explained by the linear model divided by thevariance unexplained by the model.
5 The F-statistic is calculated from the regression sum ofsquares and the residual sum of squares. The residual sum of squares is the sum of the squaredresiduals:residual ss = i=1n(yi-y^i)2= i=1nri2 Dividing by the degrees of freedom, gives the variance of the y valuess2y= i=1nri2n 2 The regression sum of squares, the residual sum ofsquares, and the standard deviation of the yvalues, s(y) are all listed in the linest output. The F-statistic is then the ratio of the variances:F=variance explainedvariance unexplained=regression ss/v1residual ss/v2=( (y^i-yav)2)/v1( (yi-y^i)2)/v2 You use the F-statistic under the null hypothesis that the data is arandom scatter of points with zeroslope. Critical values of the Fstatistic are listed in standardstatistics texts, the CRC Handbook,and Quantitative Analysis texts. If the F-statistic is greater thanthe F-critical value, the null hypothesis fails and the linear modelis significant.
6 For the degrees of freedom, which are abbreviatedin most tables as v1and v2,usev1=1andv2=n-k,wherekisthe number of variables in the regression analysis including theintercept and n is the number of data points. The value for v2islisted as the degrees of freedom in the linest output. A small partof the F-table is shown at right for an value of , that is, 95%confidence. For the example above, v1=1andv2=6 2= value is The F-statistic for our example is ,which is much greater than the F-critical value. You are 95% surethat your data is not a random scatter of points and that theregression is values at = (v1=1) 7. You will now needto calculate the fit y values,yi^, which are the valuesthat lie on the line at thegiven x values. You canuse the TREND arrayfunction for this, but it isjust as easy to simplycalculate the fit y valuesdirectly. Start a newcolumn next to the yvalues. In this new columnenter the formula that givesyi^=mxi+ b, with theslope and intercept fromthe LINEST output:Step 8.
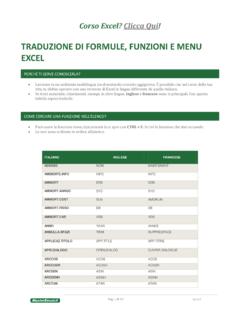
7 You can now use the "Chart Wizard" to help graph the results: first select the threecolumns in your spreadsheet . Include the column labels. Click on the Chart Wizard icon:The cursor will change shape indicating that you are to drag on your spreadsheet where you wantthe plot to appear. Remember for lab reports that charts should be at least half a Wizard will then take you through setting up your graph. Do a scatter graph, and choose theformat that has plot symbols, but not connecting 9. You now need to replace the plotting symbols for the fit y values points with connectinglines. Double click on one of the fit y value data points. The "Format Data Series" dialog box willappear. Change the default settings to no plotsymbol (marker) and connecting lines as shownbelow:The plot should nowappear as at andspreadsheet cellscan easily be copiedand pasted intoWord Tutorial Plot024681012141602468x (units?)
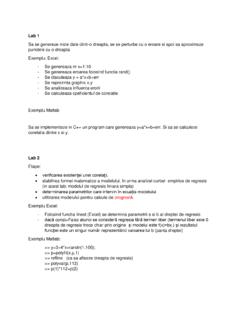
8 Yfit yAdding Error Bars to PlotsAfter you have your graph displayed you can easily add error bars. Double click on one of theplotting symbols for your data. The dialog box shown below will appear. Click on the "Y ErrorBars" tab. Click on the "Both" icon. Next click on the "Custom" button. Next click in the "+" boxand then select the cell in your spreadsheet that contains the s(y) value. Repeat this last step inthe "-" box. Click on "OK" and the error bars should appear on your final chart, in all its glory looks like this:LINEST Tutorial Plot024681012141602468x (units?)yfit y