Transcription of Educational Attainment in the United States: 2015
1 Educational Attainment in the United States: 2015 Population CharacteristicsBy Camille L. Ryan and Kurt BaumanCurrent Population ReportsP20-578 March 2016 This report provides a portrait of Educational attain-ment in the United States based on data collected from the Current Population Survey (CPS). The report exam-ines Educational Attainment of the adult population by demographic and social characteristics such as age, sex, race and Hispanic origin, and disability status, as well as differences in Educational Attainment between the native and the foreign Historical data are also included to present some general trends over time. HIGHLIGHTS In 2015, almost 9 out of 10 adults (88 percent) had atleast a high school diploma or GED, while nearly 1 in 3adults (33 percent) held a bachelor s or higher The percentage of women who had a bachelor sdegree or higher (33 percent) was not statistically dif-ferent than the percentage of men (32 percent) withthis level of education.
2 Educational Attainment varied by race and Hispanicorigin. More than half of Asians aged 25 and olderhad a bachelor s degree or higher in Asians were more likely than non-Hispanic Whites to have at least a bachelor s degree. Asians and non-Hispanic Whites were more likely tohold a bachelor s degree or higher compared withBlacks and Hispanics. Native adults were more likely to have a high schooleducation or higher but were no more likely thanforeign-born adults to hold an advanced degree. Adults without a disability were more likely to holda bachelor s degree or more than adults with PORTRAIT OF Educational Attainment In 2015, the majority (88 percent) of adults were at least high school graduates and more than half (59 percent) had completed some college or more (Table 1). One out of three adults (33 percent) reported they had a bachelor s degree or more education, and 12 percent reported an advanced degree, such as a master s, pro-fessional, or doctorate degree.
3 Educational Attainment varied by age, sex, race and Hispanic origin, nativity, and disability The adult population is defined as the population 25 and older for the purposes of this The percentage before rounding can be found in Table 1 of this report. Although the estimate found in the table ( percent) can be rounded to 33 percent, this estimate is statistically different than 33 percent. All comparisons in this report are statistically significant at the 90 percent level unless stated otherwise. The estimates are based on responses from a sample of the population and may differ from actual values because of sampling variability or other factors. As a result, apparent differences between the estimates for two or more groups may not be statistically Federal surveys now give respondents the option of reporting more than one race.
4 Therefore, two basic ways of defining a race group are possible. A group such as Asian may be defined as those who reported Asian and no other race (the race-alone or single-race concept) or as those who reported Asian regardless of whether they also reported another race (the race-alone or in-combination concept). This report shows data using the first approach (race alone). Use of the single-race population does not imply that it is the preferred method of presenting or analyzing data. For further information, see the 2010 Census Brief, Overview of Race and Hispanic Origin: 2010 (C2010BR-02) at < >. Census BureauAge. The overall increase in edu-cational Attainment documented over the past 6 decades occurred as younger (and more educated) cohorts replaced older, less edu-cated cohorts in the adult popula-tion.
5 In 2015, the 65 and older age group reported lower levels of high school and college Attainment than all younger age groups. Among adults aged 65 and older, 84 per-cent had completed high school or more education compared to 91 percent of adults aged 25 to 34 and 89 percent of adults aged 35 to 44 years or 45 to 64 years (Table 1). In addition, 27 percent of the population aged 65 and older reported a bachelor s degree or more education compared to 36 percent of adults 25 to 34 years old and 32 percent of adults aged 45 to 64 years (Table 1). Sex. Educational Attainment differed between men and women. In 2015, about 90 percent of both men and women had completed high school or more. However, a higher per-centage of women had completed at least some college. Sixty percent of women had some college or more education compared to 58 percent of men.
6 Thirty-two percent of men and 33 percent of women had completed at least a bachelor s degree and 12 percent of each sex held an advanced and Hispanic Origin. Educa-tional Attainment also varied by race and Hispanic origin. Non-Hispanic Whites reported the highest percentage of adults with at least a high school education 4 The percentage of men who held a bach-elor s degree or higher was not statistically different from the percentage of women. Data from the American Community Survey (ACS), released by the Census Bureau in September 2015, show that women 25 years and older have a higher rate of college completion than men. The ACS is able to measure smaller differences in the population due to its larger sample size. See the blog entitled Women Now at the Head of the Class, Lead Men in College Attainment at <.
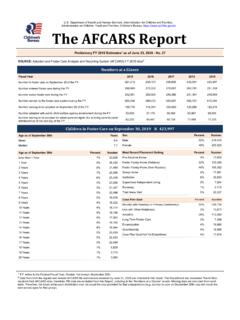
7 Gov/2015/10/07/women-now-at-the-head -of-the-class-lead-men-in-college - Attainment />.Table 1. Educational Attainment of the Population Aged 25 and Older by Age, Sex, Race and Hispanic Origin, and Other Selected Characteristics(Numbers in thousands)CharacteristicTotalHigh school graduate or moreSome college or moreAssociate s degree or moreBachelor s degree or moreAdvanced degreePercentMargin of error1 ( )PercentMargin of error1 ( )PercentMargin of error1 ( )PercentMargin of error1 ( )PercentMargin of error1 ( )Population 25 and older .. 212,132 88 .40 .358 .90 .542 .30 .532 .50 .512 .00 .3 Age25 to 34 .. 43,006 90 .50 .665 .00 .946 .50 .936 .11 .010 .90 .635 to 44 .. 39,919 88 .70 .562 .80 .946 .71 .036 .31 .013 .80 .745 to 64 .. 83,213 89 .40 .459 .00 .742 .60 .732 .00 .712 .10 .565 and older.
8 45,994 84 .30 .749 .70 .934 .10 .926 .70 .811 .30 .7 SexMale .. 101,888 88 .00 .457 .60 .741 .20 .732 .30 .612 .00 .4 Female .. 110,245 88 .80 .360 .10 .643 .40 .632 .70 .612 .00 .4 Race and Hispanic originWhite alone ..168,42088 .80 .359 .20 .642 .80 .632 .80 .612 .10 .3 Non-Hispanic White alone ..140,63893 .30 .363 .80 .646 .90 .736 .20 .713 .50 .4 Black alone ..25,42087 .00 .952 .91 .432 .41 .422 .51 .28 .20 .7 Asian alone ..12,33189 .11 .270 .01 .960 .42 .053 .92 .021 .41 .5 Hispanic (of any race) .. 31,020 66 .71 .136 .81 .022 .70 .915 .50 .74 .70 .4 Nativity StatusNative born .. 175,519 91 .80 .361 .30 .543 .30 .632 .70 .611 .90 .3 Foreign born .. 36,613 72 .01 .047 .61 .137 .61 .131 .41 .112 .50 .7 Disability StatusWith a disability .. 28,052 78 .60 .941 .61 .224 .91 .016 .70.
9 95 .70 .5 Without a disability .. 183,351 89 .9 0 .361 .50 .5 45 .0 0 .6 34 .9 0 .5 12 .9 0 .31 A margin of error is a measure of an estimate s variability . The larger the margin of error in relation to the size of the estimate, the less reliable the estimate . When added to and subtracted from the estimate, the margin of error forms the 90 percent confidence interval .Source: U .S . Census Bureau, 2015 Current Population Survey . Census Bureau 3(93 percent). Asians reported the highest percentage of those with a bachelor s or higher degree (54 percent). Hispanics reported the lowest percentage at every level from high school graduate or more (67 percent) to advanced degrees (5 percent).Disability Status. Adults who reported a disability had lower lev-els of Educational Attainment com-pared to those without a disability.
10 Seventy-nine percent of adults who had a disability had at least a high school diploma while 90 percent of those without a disability had completed a high school education or more. In addition, the percent-age of those who had completed a bachelor s degree or more was about twice as large for those with-out a disability compared to those with a disability. Thirty-five percent of adults without a disability held at least a bachelor s degree com-pared to 17 percent of adults with a disability. Nativity Status. The Educational Attainment of the native and foreign-born populations differ in distribution (Figure 1). The foreign born had a higher proportion of adults with less than a high school education (28 percent) compared to natives (8 percent). However, on the opposite end of the educa-tional spectrum, the foreign born were just as likely as the native population to hold an advanced degree (13 percent versus 12 per-cent respectively, not significantly different).