Transcription of ELECTRON SPIN RESONANCE OBJECTIVES
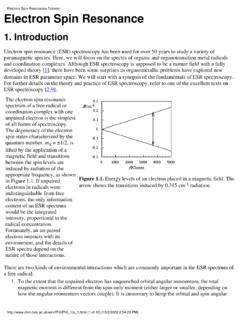
1 ELECTRON spin RESONANCEOBJECTIVES* To learn some properties of a simple microwave reflection spectrometer.* To calibrate the magnetic field using DPPH.* To measure the g factor, nuclear spin , and hyperfine coupling constant of the 55Mn2+ * A. Melissinos, Experiments in Modern Physics* Alger, ELECTRON paramagnetic RESONANCE * Poole, ELECTRON spin RESONANCE * Wertz & Bolton, ELECTRON spin RESONANCE , Elementary theory and ApplicationsAssignment:Measure cavity Q, f0 Calibrate the magnetic field with the DPPH. Try the McC12 next. Understand g factor, the hyperfine interaction, a magnetic dipole transition, a Faraday isolator, an attenuator, and Q as used (also known as EPR -- ELECTRON paramagnetic RESONANCE ) is to ELECTRON spins as NMR (nuclear magnetic RESONANCE ) is to nuclear spins. In the case of ESR, transitions between energy levels of electronic magnetic moments in a magnetic field are induced by an externally applied radio frequency electromagnetic field.
2 Since electronic mag-netic moments are much greater in magnitude than nuclear moments, their energy levels in a given magnetic field are much more widely split. Correspondingly, the energy of the RF quanta which induce transitions are much higher, so that while the RF frequencies involved in NMR work are one the order of 20 MHz, the frequencies used in ESR work are in the microwave range: in our case, to GHz, corresponding to wavelengths of about 3 REFLECTION SPECTROMETER: Fig. 1 The system used in our lab for ESR work, called a reflection spectrometer, is dia-grammed on the following page. The sample to be investigated is placed in a glass tube within a microwave cavity between the pole faces of an electromagnet. Microwave power is directed from an oscillator to an outside wall of the cavity, where a portion of the power enters through a hole called the iris.
3 The extents of the waveguide cavity are defined at one end by the iris, and at the other by a screw driven plunger. A fraction of the incident RF power is reflected, and this reflected power is monitored by the indicated detector. The resonant frequency of the cavity (which is determined by physical dimen-sions and is independent of magnetic field) is adjusted to correspond to the frequency of the oscillator, and the phase of the incident microwave is adjusted to give a maximum power transfer into the cavity with minimum reflection. While keeping the microwave frequency fixed, the magnetic field is varied until spin reso-nance occurs. At RESONANCE , microwave power is absorbed by the sample, resulting in a net change in the characteristics of the cavity, with a consequential increase in the amount of reflected power.
4 The variation in the reflected power as a function of magnetic field strength is the signal which will be measured in this microwave system uses so-called X-band components (designed for use in a fre-quency range of 8-12 GHz). You should learn the function and principle of operation of these devices, including the Faraday isolator, wavemeter, directional coupler, slotted line tuner, iris coupler, resonant cavity, and diode detector (lots of good physics here!).MICROWAVE SOURCET here are a variety of microwave RF sources than can be used in this experiment. Among them are the klystron, the H-P BWO sweep oscillator, the Gunn diode oscillator, and the phase locked transistor oscillator. The first two are tube type oscillators and are somewhat noisy and/or unstable. The lat-ter two are solid state oscillators, and are quiet, stable and easy to use.
5 For this experi-ment we will use the most stable phase locked bipolar transistor STATE MICROWAVE RF OSCILLATORSThe solid state oscillator is the preferred RF source for the ESR/EPR experiment. How-ever, these devices are somewhat delicate. Extreme care must be used when connect-ing these devices to their DC power supply. Excessive voltage (or current) and/or reversed polarity can destroy these devices).Solid state oscillators are powered by a single, variable voltage, regulated DC power supply capable of producing 20 volts DC at 1 amp. Our Power Designs TP340 works nicely for microwave frequencies are too high to observe and measure directly with conven-tional means, a microwave mixer diode is used. The diode rectifies the AC RF signal, and produces a DC voltage that is proportional to the RF amplitude, much like an AM radio on the power supply for the microwave oscillator.
6 It is best to check the operating voltage first, before connecting it to the oscillator. The recommended operating voltage is -20 volts. Every effort must be taken not exceed this voltage. It is probably to set the supply to 0 volts, then bring it up to 20. Also please note the can verify that it is operating by measuring the current at the detector on the waveguide near the oscillator using the first measurement should be to find the frequency of your oscillator. Slowly adjust the wavemeter through the range of 9 to 11 GHz. Look for a dip in the output detector voltage on the oscilloscope. Take the reading between two red lines on the wavemeter. Record this value for your calculations, and compare it with the frequency printed on the your sample* into the waveguide cavity between the poles of the magnet.
7 The axis of the waveguide should be at exactly 900 to the field, and the sample should be centered in the a rubber o-ring around the sample tube to help keep it positioned. A tiny change in position will affect the null of the the detector output to the oscilloscope. Adjust the micrometer on the slide screw tuner so that the probe tip does not extend into the waveguide (counter clock-wise 1/2"), and monitor the DC detector output on the scope. Do not unscrew the probe the resonant frequency of the cavity to the oscillator by tuning the cavity termina-tion adjustment for a dip (or null) in the reflected RF at the detector output. Carefully adjust the cavity for a minimum, then use the micrometer probe insertion adjustment of the slide screw tuner to improve the null (further reduce power reflected from the cavity.)
8 Use thumb wheel knob to position the probe at the proper phase in the RF field, and fur-ther improve the null. This should reduce the reflected signal at the detector to just a few tenths of a may begin a search for RESONANCE by applying the magnetic field. The main B field is supplied by the 9" Varian magnet and its power supply. Before turning on the power supply, open the chilled water lines, return line first then supply line -- (close in the reverse order).Slowly sweep the power supply manually through the range between 50 and 60 amps. You should make a calculation to determine more precisely the magnetic field at which RESONANCE will occur. Use the magnet calibration curve (taped to the magnet) to convert from field in KGauss to current in amps. Use the oscilloscope to look for a "jump" in the detector output as you cross RESONANCE .
9 Use the sweep motor to produce a slow, repet-itive sweep when you are ready to take one piece at a time begin connecting and testing the pre-amp, the H-P sinewave oscillator, and ultimately the lock-in amplifier.*(DPPH, a black crystalline power, is a very good calibration sample.) See paper by David Papas for MN2+ sample preparation. PAR 113 Pre-AmplifierThe Princeton Applied Research pre-amplifier serves a dual function: 1.) to increase the amplitude of the signal from the detector, and 2.) to limit the bandwidth of the signal com-ing from the detector. The gain needs normally to be set to either 10 or 100 as the signal in many cases will be "reasonably" large. A more important function is to limit the amount of noise coming from the detector, and to improve the signal to noise ratio. To properly set the band limits, one must consider the frequency characteristics of the signal, as well as the characteristics of the filter itself.
10 For the high frequency cut-off, make sure the filter is set ABOVE the mod-ulating frequency. Note that if the filter is set too close to the modulating frequency, it will attenuate your signal as well as the noise because it's roll-off slope is on the order of 6dB per octave. On the low frequency end, consider that the low frequency roll-off should be correspondingly lower than the modulating will use a gaussmeter to make the actual measurements of your magnetic field. The sensitive area of the hall probe is inches from the end. The plane of the probe must be precisely normal to the magnetic field. It should be placed as close to the sample as possible for an accurate measurement of the field near the data can be plotted on the XY Plotter as; lockin amplifier output as a function of magnetic field. The ratiometric output of the gaussmeter is used to drive the X axis of the XY plotter.