Transcription of Introduction to Electron Paramagnetic Resonance …
1 EPR spectroscopy 2016 PSU Bioinorganic Workshop 1 Introduction to Electron Paramagnetic Resonance spectroscopy Art van der Est, Department of Chemistry, Brock University St. Catharines, Ontario, Canada EPR spectroscopy 2016 PSU Bioinorganic Workshop 2 EPR spectroscopy Molecules with all electrons paired have no Electron magnetic moment no EPR spectrum. Species that can be studied by EPR: free radicals transition metals with odd numbers of electrons or high spin excited states with S 0 triplet states EPR is magnetic Resonance on unpaired electrons EPR spectroscopy 2016 PSU Bioinorganic Workshop 3 Bioinorganic EPR The metals in metalloproteins usually do redox chemistry and are the active sites of the protein.
2 The redox states are often Paramagnetic . (two general classes: S = , S > ) These states can be studied by EPR No background signals from the rest of the protein or sample. Examples: Iron-sulfur proteins, heme and non-heme iron proteins, iron-nickel proteins, copper proteins EPR spectroscopy Basics of the EPR experiment EPR in proteins at low temperature (S = ) g-anisotropy, single crystals, powder patterns The hyperfine interaction Couplings between electrons, Zero Field Splitting (S > ) High spin systems and Rhombograms 2016 PSU Bioinorganic Workshop 4 Outline EPR spectroscopy Hagen (2009) Biomolecular EPR spectroscopy , CRC Press Brustolon and Giamello (2008) Electron Paramagnetic Resonance .
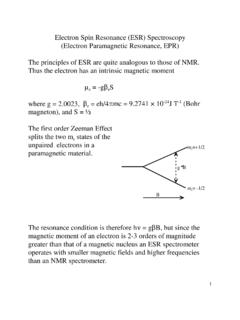
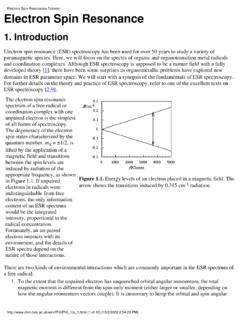
3 A Practitioner's Toolkit Wiley Weil and Bolton (2007) Electron Paramagnetic Resonance : Elementary theory and Practical Applications Wiley Golbeck and van der Est (2013) in Molecular Biophysics for the Life Sciences Allewell, Narhi and Rayment Eds. 2016 PSU Bioinorganic Workshop 5 References EPR spectroscopy 2016 PSU Bioinorganic Workshop 6 Basics of EPR Electrons have spin angular momentum which generates a magnetic dipole moment . e S S S=ge es(s+1) e = Bohr magneton ge = free Electron g-value s = spin angular momentum quantum number Sge= e= 10 24J/T SEPR spectroscopy 2016 PSU Bioinorganic Workshop 7 Energy Magnetic field EPR Experiment ms= 12ms=+12 E=h =ge eB0ge eh= a magnetic field the spin states are split by the Zeeman interaction.
4 Transitions with are allowed in an EPR experiment. ms= 1 EPR spectroscopy The Resonance frequency for a free Electron is about 600 times larger than for a proton in the same magnetic field: 300 MHz 1H NMR 180 GHz EPR 180 GHz = 6 cm-1 microwave/far infrared 2016 PSU Bioinorganic Workshop 8 Comparison with NMR spectroscopy Couplings involving electrons are generally much stronger this leads to much broader spectra: NMR: 1 Hz 100 kHz EPR: 1 MHz several GHz EPR spectroscopy 2016 PSU Bioinorganic Workshop 9 Basics of EPR In atoms and molecules the electrons have both orbital and spin angular momentum.
5 Each of these generates a magnetic dipole moment. L= el(l+1)e L L S S S=ge es(s+1)EPR spectroscopy 2016 PSU Bioinorganic Workshop 10 Basics of EPR The magnetic moment of a bound Electron is determined by its total angular momentum =g eJ(J+1) JIn molecules, the orbital angular momentum is generally quenched. Some residual orbital angular momentum remains Exact g-value depends on the spin-orbit coupling: Examples. Cu(II) in Cu(acac)2 g= Ti(III) ions in solid TiO2 g= J S, g ge EPR spectroscopy 2016 PSU Bioinorganic Workshop 11 Choice of Field and Frequency Commercially available spectrometers: Frequency (GHz) Frequency Band Field for g= (T) L S X 34 Q 95 W 263 mm-band X-band spectrometers are by far the most common.
6 EPR spectroscopy 2016 PSU Bioinorganic Workshop 12 The EPR Experiment In an EPR experiment the absorbance is very weak and this method is only feasible at very high magnetic fields. In most spectroscopic experiments the absorbance is measured as a function of frequency. source I0IA = log10I( )I0( )#$%&'(EPR spectroscopy 2016 PSU Bioinorganic Workshop 13 The EPR Experiment To overcome the problem of weak signals a resonator is used: The sample is placed in a resonant cavity such that it sits in the magnetic component of the resonant microwave field magnetic lines of force electric lines of force sample Many other resonator designs are possible.)
7 Each has its advantages EPR spectroscopy 2016 PSU Bioinorganic Workshop 14 The EPR Experiment The microwaves are usually brought to the resonator using a waveguide Image: Buker ER 4103TM cylindrical mode resonator waveguide resonator An iris is placed at the entrance to the resonator to couple it. entrance slit iris Hagen Biomolecular EPR spectroscopy Fig. EPR spectroscopy 2016 PSU Bioinorganic Workshop 15 EPR Cavity Coupling By adjusting the shape of the iris, the source is critically coupled to the cavity so no power is reflected.
8 Frequency Reflected power Frequency Reflected power Frequency Reflected power Over coupled Critically coupled Under coupled EPR spectroscopy 2016 PSU Bioinorganic Workshop 16 The EPR Experiment When an EPR transition occurs in the sample, the Resonance is disturbed and power is reflected The reflected power gives a stronger signal than directly measuring the absorbance of the sample EPR spectroscopy 2016 PSU Bioinorganic Workshop 17 EPR Spectrometer Typical resonator bandwidth: ~1-10 MHz Spectral width: up to several GHz Net result: Cannot sweep the frequency.
9 Therefore EPR spectrometers typically use electromagnets and the microwave absorption is monitored as the field is varied. Image: Bruker EMX EPR Spectrometer from Physikalische Technische Bundesanstalt EPR spectroscopy 2016 PSU Bioinorganic Workshop 18 Schematic Diagram of an EPR Spectrometer DetectorshifterPhaseMicrowaveSourceCircu latorAttenuatorLock inamplifier100 kHzModulationPreamplifierResonatorMagnet To computerMicrowave bridgeattenuatorBiasEPR spectroscopy 2016 PSU Bioinorganic Workshop 19 The modulation coils are placed on the sides of the resonator Even with a resonator the signals are still very noisy.
10 So a different detection scheme is used. To improve signal to noise, a small modulation field is added to the main magnetic field Field modulation technique: Image: Buker ER 4103TM cylindrical mode resonator EPR spectroscopy B02016 PSU Bioinorganic Workshop 20 Field modulation technique: The amplitude of the modulated signal is measured and its phase is compared to a reference signal absorption line modulation field modulated signal EPR spectroscopy 2016 PSU Bioinorganic Workshop 21 The amplitude of the modulated signal plotted as the EPR spectrum.