Transcription of Endothermic and Exothermic Reactions
1 Endothermic and Exothermic Reactions Many chemical Reactions give off energy. Chemical Reactions that release energy are called Exothermic Reactions . Some chemical Reactions absorb energy and are called Endothermic Reactions . You will study one Exothermic and one Endothermic reaction in this experiment. In Part I, you will study the reaction between citric acid solution and baking soda. An equation for the reaction is: H3C6H5O7(aq) + 3 NaHCO3(s) 3 CO2(g) + 3 H2O(l) + Na3C6H5O7(aq) In Part II, you will study the reaction between magnesium metal and hydrochloric acid. An equation for this reaction is: Mg(s) + 2 HCl(aq) H2(g) + MgCl2(aq) OBJECTIVES In this experiment, you will Study one Exothermic and one Endothermic reaction.
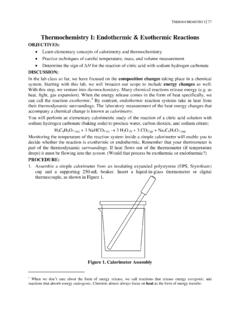
2 Become familiar with using Logger Pro. Collect and display data on a graph. Figure 1 Chemistry with Computers 1-1 Experiment 1 MATERIALS computer Vernier computer interface Logger Pro Temperature Probe 50 mL graduated cylinder balance Styrofoam cup 250 mL beaker citric acid, H3C6H5O7, solution baking soda, NaHCO3 hydrochloric acid, HCl, solution magnesium, Mg PROCEDURE 1. Obtain and wear goggles. Part I Citric Acid plus Baking Soda 2. Place a Styrofoam cup into a 250 mL beaker as shown in Figure 1. Measure out 30 mL of citric acid solution into the Styrofoam cup.
3 Place a Temperature Probe into the citric acid solution. 3. Connect the probe to the computer interface. Prepare the computer for data collection by opening the file 01 Endo Exothermic from the Chemistry with Vernier folder of Logger Pro. 4. Weigh out g of solid baking soda on a piece of weighing paper. 5. The Temperature Probe must be in the citric acid solution for at least 30 seconds before this step. Begin data collection by clicking . After about 20 seconds have elapsed, add the baking soda to the citric acid solution. Gently stir the solution with the Temperature Probe to ensure good mixing.
4 Collect data until a minimum temperature has been reached and temperature readings begin to increase. You can click on to end data collection or let the computer automatically end it after 300 seconds. 6. Dispose of the reaction products as directed by your teacher. 7. To analyze your data: a. Click the Statistics button, . In the statistics box that appears on the graph, several statistical values are displayed for Temp 1, including minimum and maximum. In your data table, record the maximum as the initial temperature and the minimum as the final temperature. Close the statistics box by clicking the upper-left corner of the box.
5 1-2 Chemistry with Computers Endothermic and Exothermic Reactions b. When you again collect data in Part II of this experiment, the data will be collected as Latest run, the most recent set of data you have collected. The original Latest run will be lost if it is not saved or stored. Choose Store Latest Run from the Experiment menu to store Latest as Run 1, then save or print it later. Note that the line for Run 1 is thinner than it was for Latest. Part II Hydrochloric Acid Plus Magnesium 9. Measure out 30 mL of HCl solution into the Styrofoam cup. Place the Temperature Probe into the HCl solution.
6 Note: The Temperature Probe must be in the HCl solution for at least 45 seconds before doing Step 11. CAUTION: Hydrochloric acid is caustic. Avoid spilling it on your skin or clothing. Wear chemical splash goggles at all times. Notify your teacher in the event of an accident. 10. Obtain a piece of magnesium metal from the teacher. 11. Begin data collection by clicking . After about 20 seconds have elapsed, add the Mg to the HCl solution. Gently stir the solution with the Temperature Probe to ensure good mixing. CAUTION: Do not breathe the vapors! Collect data until a maximum temperature has been reached and the temperature readings begin to decrease.
7 Then click stop. If temperature does not decrease, data collection will automatically stop at 5 minutes. This is OK. 12. Dispose of the reaction products as directed by your teacher. 13. To analyze your Part II data: a. Change the appearance of the graph by double-clicking anywhere on the graph bring up the Graph Options dialog. Check the box in front of Point Protector a point protector will now outline each data point on the graph window in this trial, click the Examine button, . The cursor will become a vertical line. As you move the mouse pointer across the screen, the temperature and time values corresponding to its position will be displayed in the box at the upper-left corner of the graph.
8 Scroll across the initial 3-4 points to determine the initial temperature. Record the initial temperature in the data table. Move the mouse pointer across the peak of the temperature curve to determine the maximum temperature, and record it as the final temperature in your data table. To remove the examine box, click the upper-left corner of the box. 14. To print a graph of temperature vs. time showing both data runs: Chemistry with Computers 1-3 Experiment 1 . a. Label both curves by choosing Text Annotation from the Insert menu, and typing Endothermic (or Exothermic ) in the edit box.
9 Then drag each box to a position near its respective curve. Adjust the orientation of the arrowhead by clicking and dragging to the desired position. b. Print a copy of the graph. Enter your name(s) and the number of copies of the graph you want. 15. When you have a satisfactory copy of your lab,close LoggerPro without saving anything. Make sure you do not do this until you have a graph in your hand that is correct. Finally, shut down the computer properly. DATA TABLE Part I Part II Final temperature, t2 C C Initial temperature, t1 C C Temperature change t C C OBSERVATIONS PROCESSING THE DATA 1.
10 Calculate the temperature change, t), for each reaction by subtracting the initial temperature, t1, from the final temperature, t2 ( t = t2 t1). 2. Tell which reaction is Exothermic . Explain. 3. Tell which reaction is Endothermic . Explain. 4. Remember to describe any observations that took place during each reaction and include in your lab report. 1-4