Transcription of Factsheet / Minimum Disclosure Document as at 28 …
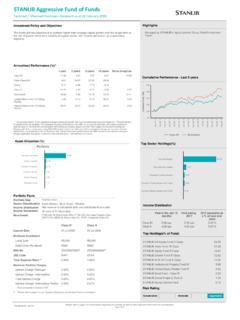
1 Please refer to page 2 for more details regarding this portfolio as well as other important information for considerationpg 1 of 3 Factsheet ID : 92180 Portfolio FactsNet revenue is calculated daily and distributed 3' millionSouth African - Interest Bearing - Variable TermBESA All Bond Index 31 March, 30 June, 30 September & 31 DecemberBenchmarkIncome DistributionSector ClassificationPortfolio SizeIncome DeclarationJSE CodeLBBFISIN Order Per MonthR500 Minimum InvestmentLump SumR5,000 Launch Date13 Mar 2000 Total Expense Ratio ** AUpfront Charge: Service Charge Intermediary Portfolio ChargesUpfront Charge: are quoted inclusive of refer to page 2 under Statutory Disclosure and General Terms & Conditions **Asset Allocation (%)Annualised Performance (%)*1 year3 years5 years10 yearsSince InceptionClass (Class A)4/335/248/182/15-Lowest Return over 12 Rolling Months Return over 12 Rolling Months *Annualized Return: is the weighted average compound growth rate over the performance period measured.
2 The performance is calculated for the portfolio. The individual investor performance may differ as a result of initial fees, the actual investment date,the date or reinvestment and dividend withholding quoted are from Morningstar for the period ending 28 February 2018 for a lump sum, using NAV-NAV prices and do not take any upfront manager's charge into account. Income distributions are declared on the ex-dividend date. Actual investment performance will differ based on the upfront manager's charge applicable, the actual investment date and the date of reinvestment of Policy and ObjectivesThe fund aims to achieve capital growth and income generation by investing in long-term fixed interest Bond FundFactsheet / Minimum Disclosure Document as at 28 February 2018 Risk RatingConservativeModerateAggressiveInco me DistributionClass AMar cpuJun cpuSep cpuDec cpuPaid in the last 12 cpuPaid during cpuAs a % of 2017 year end Ten Institutional Exposure (%)
3 Cumulative Performance - Last 5 yearsHighlightsContact DetailsSTANLIB Collective Investments (RF)Pty LimitedReg. No. 1969/003468/0717 Melrose BoulevardMelrose ArchJohannesburgSouth AfricaPO Box 202 Melrose Arch20760860 123 No :HX2381 Contact CentrePublished Date :3/20/2018 Fund review The size of the Stanlib Bond Fund at the end of the fourth quarter was , having increased by R300m from the previous quarter. After being reduced to years below the benchmark during the quarter in response to the deteriorating bond outlook following a disappointing budget speech, the modified duration was increased to years, slight above benchmark, as bond yields reached fair value levels.
4 The fund retained the overweight position in credit and was underweight 12+ area of the yield AheadThe All Bond Index returned an impressive in the month of December, which led to a full year return of in 2017. The performance can largely be attributed to the market rally due to the outcome of the ruling party s elective conference, where the perceived market-friendly candidate was elected as the party was a quarter of two halves for the bond market, which printed its year-to-date performance lows earlier in the quarter due to negative effects of the worse than expected Medium Term Budget Policy Statement tabled by the new finance minister in October.
5 The statement showed worsening fiscal matrices, with no clear plan to improve these in the medium term, which led to Standard & Poor s downgrading both the local and foreign currency sovereign ratings, firmly placing then in junk territory. Moody s placed the country on a ratings review for a downgrade. The unexpected rating agency action led to rand and the 10 year bond printing the year-to-date weakest levels of $ and respectively. The 5 year CDS spread also worsened by 50 basis points to trade 220bps, before improving in the latter part of the quarter due to the unwinding of political risk premium to close the year at 157bps.
6 The 10 year bond yield ended the quarter largely unchanged at while the rand rallied to $, which is the strongest level in two years, before closing at $. Foreigners were net sellers of R18bn of local bonds in the quarter, which brought the 2017 net inflows down to R50bn, as the ratings downgrades sparked fears of the country being excluded from global bond US Federal Reserve hiked the short term rates by another 25 basis points in December, in line with market expectations, bringing the 2017 cumulative hikes to 75 basis points. The European Central Bank continued with monetary stimulus, albeit at a slower pace, as they extended their quantitative easing programme by another nine months but at half the size of the previous one.
7 Synchronized global growth in 2018 and tighter labour markets are expected to be inflationary, which might lead tVictor MphaphuliVictor joined SCMB Treasury in 1996 as a trainee dealer in the foreign exchange markets and later moved to Nedcor as a capital markets dealer. In early 2001, he joined Libam s (now STANLIB) fixed interest team as a capital markets dealer and assistant to Henk Kobo Industry experience - 9 yearsSylvester started his career in 2009 at ABSA Capital as a Credit Quantitative Analyst focusing on pricing and management of risk on all derivatives.
8 He joined STANLIB in 2013 on the Money Market desk before moving to the Bond CommentsPortfolio ManagerSTANLIB Bond FundFactsheet / Minimum Disclosure Document as at 28 February 2018pg 2 of 3 Standard Chartered Bank, 4 Sandown Valley Crescent, Sandton, 2196, Tel: 011 217 6600 Trustees :Statutory Disclosure and General terms & ConditionsCollective Investment Schemes in Securities (CIS) are generally medium to long term investments. The value of participatory interests may go down as well as up and past performance is not necessarily a guide to the future. An investment in the participations of a CIS in securities is not the same as a deposit with a banking institution.
9 CIS are traded at ruling prices and can engage in borrowing and scrip lending. A schedule of fees and charges and maximum commissions is available on request from STANLIB Collective Investments (RF) (PTY) Ltd (the Manager). Commission and incentives may be paid and if so, would be included in the overall costs. Forward pricing is used. Fluctuations or movements in exchange rates may cause the value of underlying international investments to go up or down. Liberty is a full member of the Association for Savings and Investments of South Africa. The Manager is a member of the Liberty Group of Companies.
10 This portfolio is valued on a daily basis at 15h00. Investments and repurchases will receive the price of the same day if received prior to Total Expense Ratio (TER) of a portfolio is a measure of the portfolio s assets that were relinquished as operating costs expressed as a percentage of the daily average value of the portfolio calculated over a period of usually a financial year. Typical expenses which are deducted from a portfolio include service charges, taxes, trustee fees and audit fees. The manager does not provide any guarantee either with respect to the capital or the return of a portfolio.