Transcription of FREQUENCY-RESPONSE ANALYSIS
1 ECE4510/5510: Feedback Control 1 FREQUENCY-RESPONSE : Motivation to study FREQUENCY-RESPONSE methods Advantages and disadvantages to root-locus design approach:ADVANTAGES: Good indicator of transient response. Explicitly shows location of closed-loop poles. Tradeoffs : Requires transfer function of plant be known. Difficult to infer all performance values. Hard to extract steady-state response (sinusoidal inputs). FREQUENCY-RESPONSE methods can be used tosupplementroot locus: Can infer performance and stability from same plot. Can use measured data when no model is available. Design process is independent of system order (# poles). Time delays handled correctly (e s ). Graphical techniques ( ANALYSIS /synthesis) are quite simple. What is a frequency response? We want to know how a linear system responds to sinusoidal input, insteady notes prepared by and copyrightc 1998 2017, Gregory L.
2 Plett and M. Scott TrimboliECE4510/ECE5510, FREQUENCY-RESPONSE ANALYSIS8 2 Consider systemY(s)=G(s)U(s)with inputu(t)=u0cos( t),soU(s)=u0ss2+ 2. With zero initial conditions,Y(s)=u0G(s)ss2+ 2. Do a partial-fraction expansion (assume distinct roots)Y(s)= 1s a1+ 2s a2+ + ns an+ 0s j + 0s+j y(t)= 1ea1t+ 2ea2t+ + neant!"#$If stable,these decay to zero.+ 0ej t+ 0e j (t)= 0ej t+ 0e j t. Let 0=Aej .Then,yss=Aej ej t+Ae j e j t=A%ej( t+ )+e j( t+ )&=2 Acos( t+ ).We find 0via standard partial-fraction-expansion means: 0='(s j )Y(s)|s=j =(u0sG(s)(s+j )))))s=j =u0(j )G(j )(2j )=u0G(j )2. Substituting into our prior resultyss=u0|G(j )|cos( t+ G(j )).Lecture notes prepared by and copyrightc 1998 2017, Gregory L. Plett and M. Scott TrimboliECE4510/ECE5510, FREQUENCY-RESPONSE ANALYSIS8 3 Important LTI- system fact: If the input to an LTI system is a sinusoid,the steady-state output is a sinusoid of the same frequencybutdifferent amplitude and :Transfer function ats=j tells us response to also about stability asj -axis is stability boundary!
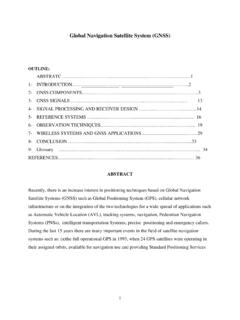
3 EXAMPLE:Suppose that we have a system with transfer functionG(s)=23+s. Then, the system s frequency response isG(j )=23+s))))s=j =23+j . The magnitude response isA(j )=))))23+j ))))=|2||3+j |=2 (3+j )(3 j )=2 9+ 2. The phase response is (j )= *23+j += (2) (3+j )=0 tan 1( /3). 123 Now that we know the amplitude and phase response, we can findthe amplitude gain and phase change caused by the system for anyspecific frequency . For example, if =3rads 1,A(j3)=2 9+9= 23 (j3)= tan 1(3/3)= notes prepared by and copyrightc 1998 2017, Gregory L. Plett and M. Scott TrimboliECE4510/ECE5510, FREQUENCY-RESPONSE ANALYSIS8 : Plotting a frequency response There are two common ways to plot a frequency response themagnitude and phase for all :Y(s)U(s)CRG(s)=11+RCs frequency responseG(j )=11+j RC(letRC=1)=11+j =1 1+ 2 tan 1( ). We will need to separate magnitude and phase information fromrational polynomials inj.
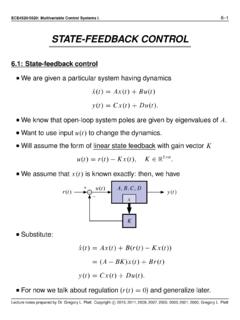
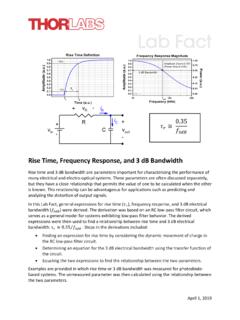
4 Magnitude = magnitude of numerator / magnitude of denominator,R(num)2+I(num)2,R(den)2+I(de n)2. Phase = phase of numerator phase of denominatortan 1*I(num)R(num)+ tan 1*I(den)R(den)+.Plot method #1: Polar plot in complex plane EvaluateG(j )at each frequency for0 < . Result will be a complex number at each frequency :a+jborAej .Lecture notes prepared by and copyrightc 1998 2017, Gregory L. Plett and M. Scott TrimboliECE4510/ECE5510, FREQUENCY-RESPONSE ANALYSIS8 5 Plot each point on the complex plane at(a+jb)orAej for eachfrequency-response value. Result = polar plot. We will later call this a Nyquist plot . G(j ) The polar plot is parametric in ,soitishardtoreadthefrequency-response for a specific frequency from the plot. We will see later that the polar plot will help us determine stabilityproperties of the plant and closed-loop method #2: Magnitude and phase plots We can replot the data by separating the plots for magnitude andphase making two plots versus notes prepared by and copyrightc 1998 2017, Gregory L.
5 Plett and M. Scott TrimboliECE4510/ECE5510, FREQUENCY-RESPONSE ANALYSIS8 , (rads/sec.)|G(j )|0123456 90 80 70 60 50 40 30 20 100 frequency , (rads/sec.) G(j ) The above plots are in a natural scale, but usually a log-log plot ismade This is called a Bode plot or Bode diagram. Reason for using a logarithmic scale Simplest way to display the frequency response of arational-polynomial transfer function is to use a Bode Plot. Logarithmic|G(j )|versus logarithmic ,andlogarithmic G(j )versus .REASON:log10*abcd+=log10a+log10b log10c log10d. The polynomial factors that contribute to the transfer function canbe split up and evaluated (s)=(s+1)(s/10+1)G(j )=(j +1)(j /10+1)|G(j )|=|j +1||j /10+1|log10|G(j )|=log10,1+ 2 log10-1+. 10 notes prepared by and copyrightc 1998 2017, Gregory L. Plett and M. Scott TrimboliECE4510/ECE5510, FREQUENCY-RESPONSE ANALYSIS8 7 Consider:log1001+* n+2.
6 For n,log1001+* n+2 log10(1)=0. For n,log1001+* n+2 log10* n+.KEY POINT:Two straight lines on a log-log plot; intersect at = n. Typically plot20 log10|G(j )|;thatis, n n10 nExactApproximation20dB Atransferfunctionismadeupoffirst-orderze rosandpoles,complexzeros and poles, constant gains and delays. We will see how tomakestraight-line (magnitude- and phase-plot) approximationsforallthese,and combine them to form the appropriate Bode notes prepared by and copyrightc 1998 2017, Gregory L. Plett and M. Scott TrimboliECE4510/ECE5510, FREQUENCY-RESPONSE ANALYSIS8 : Bode magnitude diagrams (a) Thelog10( )operator lets us break a transfer function up into pieces. If we know how to plot the Bode plot of each piece, then we simplyadd all the pieces together when we re magnitude: Constant gain dB=20 log10|K|. Not a function of straight line.
7 If|K|<1,thennegative, |K|>1|K|<1dBBode magnitude: Zero or pole at origin For a zero at the origin,G(s)=sdB=20 log10|G(j )|=20 log10|j | 20dB20dB perdecade For a pole at the origin,G(s)=1sdB=20 log10|G(j )|= 20 log10|j | 20dB 20dB perdecadeLecture notes prepared by and copyrightc 1998 2017, Gregory L. Plett and M. Scott TrimboliECE4510/ECE5510, FREQUENCY-RESPONSE ANALYSIS8 9 Both are straight lines, slope= 20dB per decade of frequency . Line intersects -axis at =1. For annth-order pole or zero at the origin,dB= 20 log10|(j )n|= 20 log10 n= 20nlog10 . Still straight lines. Still intersect -axis at =1. But, slope= 20ndBper magnitude: Zero or pole on real axis, but not at origin For a zero on the real axis, (LHPorRHP), the standard Bode form isG(s)=*s n 1+,which ensures unity dc-gain. If you start out with something likeG(s)=(s+ n),then factor asG(s)= n*s n+1+.
8 Draw the gain term ( n)separatelyfromthezeroterm(s/ n+1). In general, a LHP or RHP zero has standard Bode formG(s)=*s n 1+Lecture notes prepared by and copyrightc 1998 2017, Gregory L. Plett and M. Scott TrimboliECE4510/ECE5510, FREQUENCY-RESPONSE ANALYSIS8 10G(j )= 1+j* n+20 log10|G(j )|=20 log1001+* n+2 For n,20 log1001+* n+2 20 log10 1=0. For n,20 log1001+* n+2 20 log10* n+. Two straight lines on a log scale which intersect at = n. For a pole on the real axis, (LHPorRHP) standard Bode form isG(s)=*s n 1+ 120 log10|G(j )|= 20 log1001+* n+ is the same except for a minus n1 n10 n20dB20dB n1 n10 n 20dB 20dB perdecadeLecture notes prepared by and copyrightc 1998 2017, Gregory L. Plett and M. Scott TrimboliECE4510/ECE5510, FREQUENCY-RESPONSE ANALYSIS8 : Bode magnitude diagrams (b)Bode magnitude: Complex zero pair or complex pole pair For a complex-zero pair (LHPorRHP) standard Bode form is*s n+2 2 *s n++1,which has unity dc-gain.
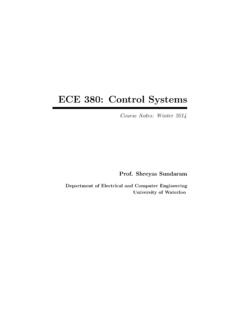
9 If you start out with something likes2 2 ns+ 2n,which we have seen before as a standard form, the dc-gain is 2n. Convert forms by factoring out 2ns2 2 ns+ 2n= 2n1*s n+2 2 *s n++12. Complex zeros do not lend themselves very well to straight-lineapproximation. If =1,thenthisis*s n 1+2. Double real zero at n slope of 40dB/decade. For =1,therewillbeovershootorundershootat n. For other values of : Dip frequency : d= n,1 2 2 Value of|H(j d)|is:20 log10(2 ,(1 2)). Note: There is no dip unless0< <1/ 2 -60-50-40-30-20-100 Dip (dB)Dip amount for 0 < < notes prepared by and copyrightc 1998 2017, Gregory L. Plett and M. Scott TrimboliECE4510/ECE5510, FREQUENCY-RESPONSE ANALYSIS8 12 We write complex poles (LHPorRHP) asG(s)=1*s n+2 2 *s n++12 1. The resonant peak frequency is r= n,1 2 2 Value of|H(j r)|is 20 log10(2 ,(1 2)).
10 Same graph as for dip for complex-conjugate zeros. Note that there is no peak unless0< <1/ 2 For n,magnitude 0dB. For n,magnitudeslope= 40 Mag: Complex = n n10 n 20dB0dB20dB40dBBode Mag: Complex poles = = n n10 n 40dB 20dB0dB20dBBode magnitude: Time delay G(s)=e s ..|G(j )|=1. 20 log101=0dB. Does not change magnitude :Sketch the Bode magnitude plot forG(s)=2000(s+ )s(s+10)(s+50).Lecture notes prepared by and copyrightc 1998 2017, Gregory L. Plett and M. Scott TrimboliECE4510/ECE5510, FREQUENCY-RESPONSE ANALYSIS8 13 The first step is to convert the terms of the transfer functioninto Bode standard form .G(s)=2000(s+ )s(s+10)(s+50)=2000 50% +1&s%s10+1&%s50+1&G(j )= +1/j .j 10+1/.j 50+1/. We can see that the components of the transfer function are: DC gain of20 log102 6dB; Pole at origin; One real zero not at origin, and Two real poles not at 210 1100101102103 60 40 20020406080 Lecture notes prepared by and copyrightc 1998 2017, Gregory L.