Transcription of HP MEMS Seismic HP MEMS Sensor Optimized for …
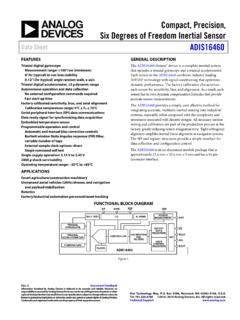
1 HP mems Seismic HP mems Sensor Optimized for Seismic Imaging Applications Sensor for Oil and The HP surface electrode inertial sensing Gas Exploration technology enables a new class of low noise, low-power mems accelerometers [1]. The mems Sensor is fabricated from 3 separate single crystal silicon wafers bonded together and singulated into a small vacuum encapsu- lated die [2]. The proofmass is suspended by Si flexures etched through the center wafer. Electrodes are arrayed on one surface of the Introduction proofmass and on the stationary wafer oppo- site the proofmass.
2 A small gap is maintained The oil and gas industry uses Seismic imag- between the two wafers. Schematic diagrams ing to provide 3-dimensional images showing of the device are shown in Figures 1 & 2. The the locations of oil and natural gas deposits. large electrode area and small electrode gap Imaging accuracy is critical to determining the provides very high sensitivity with high dynamic optimum location for drilling to increase extrac- range in an open-loop configuration. The large tion efficiency. Two critical needs for improving mass obtained with the thickness and area of image resolution and fidelity above today's the proofmass results in a low Brownian noise results are increasing the spatial density of sen- for the Sensor .
3 A Scanning Electron Microscope sors deployed in the field and generating ultra (SEM) picture of the silicon proofmass is shown low noise measurements in a wider frequency in Figure 3. band. The HP inertial sensing technology has been op- HP and Shell have recently announced a col- timized for Seismic imaging applications. The laboration to develop a next generation wireless Sensor is a single axis accelerometer that can Seismic Sensor network for oil and gas explora- achieve full dynamic range with the sense axis tion.
4 HP's inertial sensing technology is de- in any orientation by using three-phase capaci- ployed to provide very low noise at frequencies tive sensing [3]. The mems Sensor is shown in below the bandwidth of traditional geophones figure 4. Custom electronics have been de- and existing mems devices. The small size and signed to extract optimum performance from the lower power consumption of the Sensor nodes Sensor . The Sensor circuits were first developed will significantly reduce the cost of large scale using discreet electronics.
5 The electronics are deployments, enabling data from more chan- now being implemented into a custom ASIC to nels to be collected, thus increasing the channel achieve the high performance with low power, density in any given survey. small size and in high volumes. Figure 1. Three wafer mems Technology Figure 2. Schematic cross-section of mems accelerometer Figure 3. SEM of Silicon Proofmass Figure 4. HP mems Seismic Sensor HP Sensor Demonstrates Flat Test Results Demonstrates Sensor Frequency Response with Linear Noise Floor of 10 ng/rtHz Output The HP mems Seismic Sensor was tested at the One of the advantages that mems accelerom- Geological Survey's Albuquerque Seismo- eters have over geophones is the flat frequency logical Laboratory (ASL).
6 The primary goal of response at low frequencies. Unlike geophones the testing was to measure the self noise of the which are velocity sensors and operate above Sensor . The testing was done in a vault used for their resonance frequencies, accelerometers testing seismometers because of the extremely operate below their resonance frequencies. low ambient noise. The USGS provided a high The frequency response of the HP mems Sensor resolution seismometer (GS-13) to be used as a is shown in figure 5. It can be seen that while reference during the testing.
7 Geophones roll-off below their resonance fre- quencies, the gain and phase of the HP mems To determine the noise floor, the HP mems sen- Sensor is flat at frequencies from 200 Hz down sor was placed next to the GS-13 in the vault on to DC. Figure 6 shows the voltage output of the a block of granite. The experimental setup can HP Sensor vs. acceleration. The Sensor has a be seen in Figure 7. Figure 8 shows the noise linear output with no hysteresis PSD from 1 mHz to 100 Hz. The Sensor dem- onstrated a dynamic range of 120 dB and a noise power spectral density (PSD) of less than Figure 5.
8 Frequency response of HP mems Sensor Figure 6. Linear Output of HP mems Seismic Sensor 10 nG/rtHz. This noise level is equivalent to the peak of the Peterson Low Noise Model [4]. This peak results from the noise of ocean waves hit- ting the earth's shorelines, detected at the most remote locations on earth. The noise corner frequency is determined to be at 1 Hz, where the noise was 16 nG/rtHz. Below this frequency the inherent 1/f noise in the discrete Sensor electronics increases inverse- ly with frequency. When combined with the custom ASIC however, the noise density perfor- mance expected from the Sensor is < 10 ng/.
9 RtHz at frequencies from 1 to 200 Hz. Figure 7. Experimental Setup for USGS noise testing Comparison of Earthquake Signal During the testing at the USGS Lab, data from the GS-13 and the HP mems Sensor was also logged during an earthquake in the Gulf of California (Figure 9). The specific earthquake data is shown in Table 1. Fig 10 shows the time series of the vertical waveforms from the two sensors during the earthquake. A portion of this data was taken to do an analysis of the HP mems Sensor . Figure 11 shows the noise density of the two sensors Figure 8.
10 Noise PSD spectrum of HP mems Sensor during the earthquake. These waveforms show and GS-13 reference Sensor from USGS noise test excellent agreement down to frequencies of 25. mHz, indicating a flat frequency response for the HP mems Sensor . Magnitude UTC Date and time 2010/10/21 17:53:14. Latitude (Deg) Longitude (Deg) Depth 10 km Region Gulf of California Figure 9. Location of earthquake recorded dur- Table 1. Earthquake recorded during testing. ing USGS testing ( ). Summary HP has developed a mems accelerometer for use in a wireless Seismic Sensor system, utilizing HP's inertial sensing technology.