Transcription of INTERNATIONAL
1 THE INTERNATIONAL TECHNOLOGY ROADMAP FOR SEMICONDUCTORS: 2013 INTERNATIONAL TECHNOLOGY ROADMAP FOR SEMICONDUCTORS 2013 THE ITRS IS DEVISED AND INTENDED FOR TECHNOLOGY ASSESSMENT ONLY AND IS WITHOUT REGARD TO ANY COMMERCIAL CONSIDERATIONS PERTAINING TO INDIVIDUAL PRODUCTS OR EQUIPMENT. THE INTERNATIONAL TECHNOLOGY ROADMAP FOR SEMICONDUCTORS: 2013 ITRS ESIA, jeita , KSIA, TSIA, SIA THE INTERNATIONAL TECHNOLOGY ROADMAP FOR SEMICONDUCTORS: 2013 INTERNATIONAL Technology Roadmap for Semiconductors 2013 Edition( 2013 ) INTERNATIONAL Technology Roadmap for Semiconductors, ITRS STRJ jeita ITRS STRJ 15 WG.
2 Working Group ITRS 2013 1000 ITRS STRJ ITRS ITRS ITRS 2005 ITRS 2007 ITRS ITRS 2009 ITRS ITRS Microsoft Excel ITRS STRJ jeita STRJ ITRS ITRS ITRS ITRS Overview Acknowledgments ITRS ITRS 2013 Summary Summary
3 ITRS( INTERNATIONAL Technology Roadmap for Semiconductors) ITRS: INTERNATIONAL Technology Roadmap for Semiconductors ITRS INTERNATIONAL Technology Roadmap for Semiconductors Executive Summary Glossary ITRS THE INTERNATIONAL TECHNOLOGY ROADMAP FOR SEMICONDUCTORS.
4 2013 jeita SRTJ ITRS ITRS STRJ 2014 7 jeita STRJ U ORIGINAL (ENGLISH VERSION) COPYRIGHT 2014 SEMICONDUCTOR INDUSTRY ASSOCIATION All rights reserved ITRS SEMATECH, Inc. , 257 Fuller Road, Albany, NY 12203 Japanese translation by the jeita , Japan Electronics and Information Technology Industries Association under the license of the Semiconductor Industry Association ( ) ITRS 2013 Edition, Chaper XX, page YY, Figure(Table) ZZ ITRS 2013 Edition jeita XX YY , ( ) ZZ ---------------------------------------- ------- : 03-5218-1061 :HU THE INTERNATIONAL TECHNOLOGY ROADMAP FOR SEMICONDUCTORS: 2013 1.
5 1 ..1 2013 ..2 2 .. 2 ..3 ..4 3D ..7 ..15 More Moore More than Moore ..18 3 .. 18 ..18 ..18 ..25 ..31 4 .. 35 ..35 ..42 ..45 ..47 / / ..50 ..55 Si TSV 3D ..61 5 .. 68 ..68 Cu ..69 Si CMOS I/O ..75 ..77 ..78 Si CMOS ..78 6 .. 83 ESH ..83 - CPI.
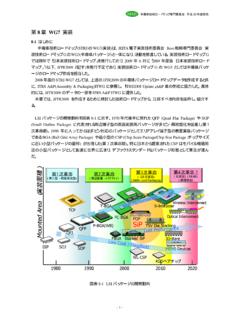
6 84 7 .. 85 ..85 ..90 RC ..91 3D TSV ..92 8 .. 93 THE INTERNATIONAL TECHNOLOGY ROADMAP FOR SEMICONDUCTORS: 2013 Figure INTC1 Typical Cross-sections of Hierarchical Scaling (MPU Device (left), ASIC (middle) and Flash memory (right)) ..4 Figure INTC2 Typical ILD Architectures ..6 Figure INTC3 Schematic Cross-sections of TSV First and Middle/Last Process Flows ..9 Figure INTC4 Schematic Representation of the Various Key Process Modules and 3D-stacking Options when using Through-Si-Via 3D-SIC Technologies.
7 11 Figure INTC5 Schematic Representation of the Various Key Process Modules and 3D-stacking Options when using Through-Si-Via 3D-WLP Technologies ..12 Figure INTC6 Experiment and model of lifetime scaling versus interconnect geometry [8] ..19 Figure INTC7 Evolution of lifetime vs. technology node. Black line shows trend for reduced critical void volume: Green line shows the EM enhancement urgently needed (Courtesies of A. Aubel/GLOBALFOUNDRIES) ..20 Figure INTC8 Calculation Model for Jmax (The maximum equivalent dc current expected to appear in a high-performance digital circuit divided by the cross-sectional area of an intermediate wire.)
8 21 Figure INTC9 Evolution of Jmax (from device requirement) and JEM (from targeted lifetime) ..21 Figure INTC10 Comparison of the Lifetime Improvement versus the Resistivity Increase for Different EM Resistance Booster Technologies [11] ..22 Figure INTC11 Comparison of EM lifetime for Cu and CuMn interconnects at (NSD = -3) as a function of line height h x via size d for various technologies. CuMn significantly enhances the EM lifetime for 40nm and 28nm nodes to levels exceeding the Cu 65nm node [29]..24 Figure INTC12 Degradation paths in Low- damascene structure.
9 25 Figure INTC13 Impact of CMP and post CMP delay time on dielectric breakdown: Dielectric breakdown voltage decreases as post Cu CMP delay time increases [2] ..26 Figure INTC14 Impact of plasma process on Low- TDDB [7] ..27 Figure INTC15 Effect of pore sealing on Low- reliability: breakdown electric field at T=100 C for a 50nm dielectric spacing of PEBO- and PCBO-integrated porous SiLKTM [8] ..27 Figure INTC16 Impact of bulk Low- property on Low- reliability: Leakage current density versus applied electric field for two CVD Low- after curing and after curing and porogen removal by He/H2 plasma [10].
10 27 Figure INTC17 Cross-section and top-down schematics of Low- planar capacitor structure designed for intrinsic TDDB study of barrier/Low- for damascene integration [11] ..28 Figure INTC18 Likelihood ratio of the simultaneous fits of all lifetime models for the 4 data sets of TABLE I with E-model was used as a reference and its likelihood ratio is 1 by definition [19] ..29 Figure INTC19 Trap spectroscopy of a = Low- dielectric [31] ..30 THE INTERNATIONAL TECHNOLOGY ROADMAP FOR SEMICONDUCTORS: 2013 Figure INTC20 Schematic representation of a typical interconnect path represented by driver, interconnect and load elements.