Example: confidence
Lead Compensators Design Using Frequency Response …
Draw Bode Plot of L1(s) Using approximated bode plot PM is found to be 17o. Using Matlab, exact PM was found to be 17.9o. We need to evaluate ϕm of the compensator to get 50o + (5o ‐12o) The maximum phase of the compensator Lead Compensator Example Solve for α The gain (Km) caused by the early zero
Tags:
Information
Domain:
Source:
Link to this page:
Documents from same domain

Physics for Scientists and Engineers, with Modern Physics ...
faculty.uml.eduA car accelerates along a straight road from rest to 90 km/h in 5.0 s. What is the magnitude of its average acceleration?

LECTURE 3 – DRILLED SHAFTS CONSTRUCTION …
faculty.uml.eduLECTURE 3 – DRILLED SHAFTS CONSTRUCTION AND DESIGN . ... essentially to deep foundation elements constructed in place, ... local design and construction …
The Matrix Exponential - UMass Lowell
faculty.uml.eduLinear Systems of Ordinary Di erential Equations Suppose that y= f(x) is a di erentiable function of a real (scalar) variable x, and that y0= ky, where kis a …
Chapter 6: Series-Parallel Circuits - UMass Lowell
faculty.uml.eduLearning with Purpose Slide 3 Combination circuits Most practical circuits have various combinations of series and parallel components. You can frequently simplify analysis by

Using a Geographic Information for Tactical Crime …
faculty.uml.eduGEOGRAPHIC INFORMATION SYSTEMS The ability of a GIs to relate and synthesize data from a variety of sources enables analysts to examine various aspects of criminal ...

“Signal Processing: A Mathematical Approach” - Answers to ...
faculty.uml.edu“Signal Processing: A Mathematical Approach” - Answers to Selected Exercises Charles L. Byrne March 26, 2008
A First Course in Optimization: Answers to Selected Exercises
faculty.uml.eduA First Course in Optimization: Answers to Selected Exercises Charles L. Byrne Department of Mathematical Sciences University of Massachusetts Lowell

Physics for Scientists & Engineers, with Modern Physics, 4 ...
faculty.uml.eduAny vector can be expressed as the sum of two other vectors, which are called its components. Usually the other vectors are chosen so that they are perpendicular to
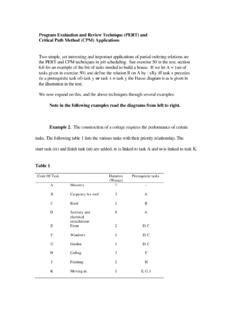
Program Evaluation and Review Technique (PERT) and ...
faculty.uml.eduProgram Evaluation and Review Technique (PERT) and Critical Path Method (CPM) Applications Two simple, yet interesting and important applications of partial ordering relations are the PERT and CPM techniques in job scheduling. See exercise 50 in the text, section

An Overview of Psychological Theories of Crime Causation
faculty.uml.eduPsychological Theory and the Criminal Justice System The field of psychology has influenced community corrections in a number of important areas:
Related documents

Basic Plotting with Python and Matplotlib
courses.csail.mit.eduplt.plot(xvals, newyvals, ’r--’) # Create line plot with red dashed line plt.title(’Example plots’) plt.xlabel(’Input’) plt.ylabel(’Function values’) plt.show() # Show the figure (remove the previous instance) The third parameter supplied to plt.plot above is …

Frequency Response and Bode Plots
web.njit.eduA Bode plot is a graph of the magnitude (in dB) or phase of the transfer function versus frequency. Of course we can easily program the transfer function into a computer to make such plots, and for very complicated transfer functions this may be our only recourse. But in many cases the key features of the plot can be quickly sketched by

Relationships on a Scatter Plot
www.sas.upenn.eduA scatter plot is a plot of the values of Y versus the corresponding values of X: - Vertical axis: variable Y--usually the dependent variable - Horizontal axis: variable X--usually the independent variable Strong relationship a clear line or predictable pattern. Weak relationship the line is there but it is “fuzzy” No relationship

ROCK YOUR PLOT • WORKBOOK
rockyourwriting.comThe third plot point is the calm before the storm of the third act: like the ―click-click- click‖ of a roller coaster, just before the plunge. Similar to the midpoint, this usually also has a new information aspect to it.
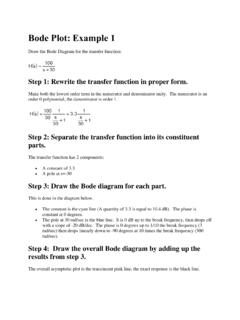
Bode Plot: Example 1 - utoledo.edu
www.eng.utoledo.eduBode Plot: Example 1 Draw the Bode Diagram for the transfer function: Step 1: Rewrite the transfer function in proper form. Make both the lowest order term in the numerator and denominator unity. The numerator is an order 0 polynomial, the denominator is order 1. Step 2: Separate the transfer function into its constituent parts.

Summary of Economic Projections
www.federalreserve.govSep 22, 2021 · For release at 2:00 p.m., EDT, September 22, 2021 Summary of Economic Projections InconjunctionwiththeFederalOpenMarketCommittee(FOMC)meetingheldon

Quick Summarizing Strategies to Use in the Classroom
www.readingrockets.orgQuick Summarizing Strategies to Use in the Classroom Compiled by Ann Lewis, Laurel School District; and Aleta Thompson, Cape Henlopen School District; April 2010 2 Written Conversations Each student begins the answer to a question or prompt posed by the teacher.