Example: confidence
Nonparametric statistics and model selection
The Kolmogorov-Smirnov test computes the statistic D n: D n = max x jF1 n (x) F2 n (x)j This compares the two CDFs and looks at the point of maximum discrepancy; see Figure5.1 for an example. We can theoretically show that if F1 is the empirical distribution of xand F2 is the true distribution xwas drawn from, then lim
Tags:
Information
Domain:
Source:
Link to this page:
Documents from same domain
Modeling Network Coded TCP Throughput: A …
www.mit.eduModeling Network Coded TCP Throughput: A Simple Model and its Validation MinJi Kim MIT Cambridge, MA 02139 minjikim@mit.edu Muriel Médard MIT Cambridge, MA 02139
LM108/LM208/LM308 Operational Amplifiers - …
www.mit.eduAbsolute Maximum Ratings If Military/Aerospace specified devices are required, please contact the National Semiconductor Sales Office/ Distributors for …
Chapter 8 New Product Development* - mit.edu
www.mit.eduUnfortunately, new product development is an extremely challenging and complex process. Innovation is inherently risky, and firms may invest considerable time and money in
The Voice of the Customer
www.mit.eduQuality Function Deployment (QFD) (see WIEM05-023), or the setting of detailed design specifications (see WIEM05-049). The Voice of the Customer process has important outputs and benefits for product developers.
Note on Conjoint Analysis - mit.edu
www.mit.eduM I T S L O A N C O U R S E W A R E > P. 1 Note on Conjoint Analysis John R. Hauser Suppose that you are working for one of the primary brands of global
a Ultralow Offset Voltage Operational Amplifiers OP07
www.mit.eduREV.A Information furnished by Analog Devices is believed to be accurate and reliable. However, no responsibility is assumed by Analog Devices for its
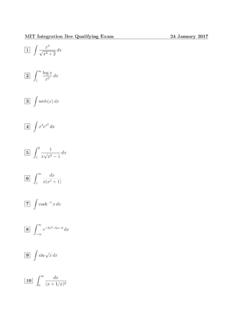
MIT Integration Bee Qualifying Exam 24 January 2017
www.mit.eduMIT Integration Bee Qualifying Exam 24 January 2017 1 Z x2 p x3 +2 dx 2 Z 1 1 logx x2 dx 3 Z sech(x)dx 4 Z x3ex2 dx 5 Z 2 1 1 x p x2 1 dx 6 Z 1 1 dx x(x2 +1) 7 Z cosh 1 xdx 8 Z 1 1 e 2x2 5x 3 dx 9 Z sin p xdx 10 Z 1 0 dx (x+1=x)2
Efficient wireless non-radiative mid-range energy …
www.mit.eduEfficient wireless non-radiative mid-range energy transfer Aristeidis Karalis a,*, J.D. Joannopoulos b, Marin Soljacˇic´ b a Department of Electrical Engineering and Computer Science, Massachusetts Institute of Technology,
Freedom of Association Is Not the Answer* - mit.edu
www.mit.eduFine Freedom of Association Is Not the Answer 339 dom of association and exclusion: few would argue with Amy Gutmann’s statement that “the freedom to associate . . . entails the freedom to
a Operational Amplifier Low-Noise, Precision OP27
www.mit.eduREV. C –3– OP27 ELECTRICAL CHARACTERISTICS (@ V S = ±15 V, –55 C £ T A £ 125 C, unless otherwise noted.) OP27A OP27C Parameter Symbol Conditions Min Typ Max Min Typ Max Unit INPUT OFFSET
Related documents

STATISTICAL TABLES - Transportation Research Board
onlinepubs.trb.orgTable C -11 Quantiles of the Smirnov Test Statistic for Two Samples of Equal Size, n. Volume II, Appendix C: page 25 Quantiles of the Smirnov Test Statistic for Two Samples of Different Size Table C-12 Quantiles of the Smirnov Test Statistic for Two Samples of Different Size, n and m.

Uji Kolmogorov Smirnov - UNIVERSITAS ISLAM MALANG
fe.unisma.ac.id•Uji Kolmogorov Smirnov merupakan pengujian normalitas yang banyak dipakai, terutama setelah adanya banyak program statistik yang beredar. •Kelebihan dari uji ini adalah sederhana dan tidak menimbulkan perbedaan persepsi di antara satu pengamat dengan pengamat yang lain, yang sering terjadi pada uji normalitas dengan menggunakan grafik.

Ko l mo g o r o v – S m i r n o v t e st
video.udacity-data.comNov 05, 2019 · The Kolmogorov–Smirnov test may also be used to test whether two underlying one-dimensional probability distributions differ. In this case, the Kolmogorov–Smirnov statistic is where and are the empirical distribution functions of the first and the second sample respectively, and is the supremum function.
Power Comparisons of Shapiro-Wilk, Kolmogorov-Smirnov ...
www.nrc.govPower comparisons of Shapiro-Wilk, Kolmogorov-Smirnov, Lilliefors and Anderson-Darling tests The numerical methods include the skewness and kurtosis coefficients whereas normality test is a more formal procedure whereby it involves testing whether a particular data follows a normal distribution.

Prueba de Bondad de Ajuste de Kolmogorov-Smirnov (KS)
www2.ulpgc.esKolmogorov Smirnov, la mayoría de los paquetes de software estadístico realizan este cálculo y proporcionan el p-valor directamente. Ejemplo 2: En los siguientes ejemplos se han simulado datos con distribución exponencial o normal, contrastándose en todos los casos si puede

Testing for Normality - Shippensburg University
webspace.ship.eduKolmogorov-Smirnov a Shapiro-Wilk *. This is a lower bound of the true significance. a. Lilliefors Significance Correction. Statistical tests for normality are more precise since actual probabilities are calculated. Tests for normality calculate the probability that the sample was

AEROSOL OPTICAL DEPTH - NASA
aeronet.gsfc.nasa.govSmirnov 2004). Angstrom Parameter . The size distribution of aerosols can be estimated from spectral aerosol optical depth, typically from 440nm to 870nm. The negative slope (or first derivative) of AOT with wavelength in logarithmic scale …

The PSMATCH Procedure - SAS
support.sas.com7678 F Chapter 95: The PSMATCH Procedure Figure 95.1 Propensity Score Analysis After balance is achieved, you can add the response variable to the output data set that PROC PSMATCH created and perform an outcome analysis that mimics the analysis you would perform with data from a