Transcription of Overview of various methods for measuring a lens focal length
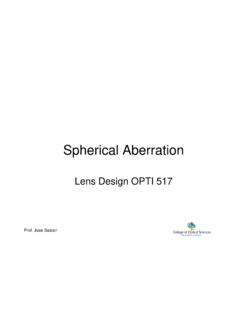
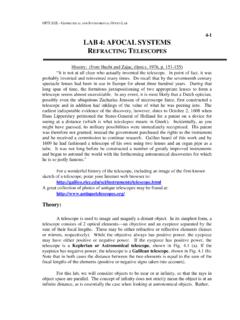
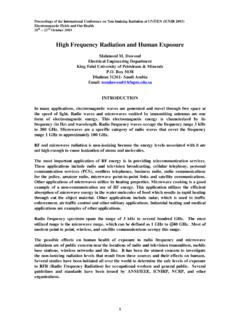
1 methods for measuring a lens focal length December 2011. Sophie Morel OPTI 521: Tutorial Introduction The focal length is one of the most important parameter of a lens. Sometimes the focal length is slightly different from the datasheet value given by the manufacturer, having an impact on the predicted optical system performances. Many methods have been elaborated to measure with more or less accuracy a lens' focal length . Some methods are easy to implement, other require more material and analyses, with more accurate measurements. By definition, the effective focal length EFL is the distance between the rear principal point P', and the rear focal point F' of the lens. The back focal length BFL is the distance between the rear vertex V' of the lens, and the rear focal point F'.
2 The front focal length FFL is the distance between the front focal point F and the front vertex V. Figure 1 : focal length definition measuring the back focal distance is usually easy. Determining the distance between P' and V' is a bigger issue. Besides, the result accuracy depends on several parameters, such as the glass index inhomogeneity, surfaces errors, radiuses of curvature error The lens application defines the accuracy needed on its focal length knowledge. This tutorial first describes in detail methods which are easy to implement in student labworks sessions. The last methods are usually more accurate, but require more equipment and analyses. 1. 1. Quick estimation The easiest and fastest way to roughly evaluate a lens focal length is to hold it under a ceiling light.
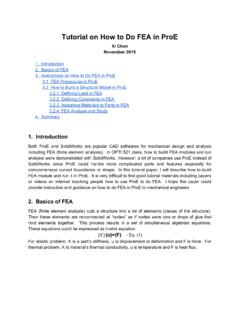
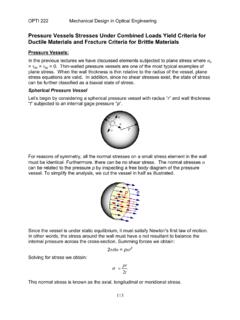
3 A projection screen (the floor, or the surface table) is under the lens. The optical element is moved vertically back and forth until a sharp image of the ceiling light is projected on the screen. The distance between the lens and the projection surface gives an idea of the focal length . Of course, there is no precision with this technique, but it can be used to check the results obtained with other methods . 2. Y'/tan( ) method a. Principle This method uses the paraxial optic formula which relates the focal length with the image height and the angle of incidence: = . tan = . tan Figure 2: y' = f'.tan( ). Assuming that the lens is in the air, its nodal points are coincident with its principal points, and the angle in the image space is equal to the angle of incidence in the object space: = '.
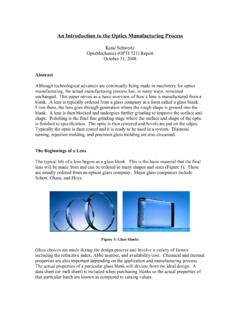
4 B. Measurement Here is the setup drawing: Figure 3: y'/ tan( ) setup The reticle is located at the front focus of the collimated lens. It is illuminated by a light source. Thus, the reticle appears to be at infinity for the test lens, and its image is located at the rear focal plane of the lens. The angular size of the reticle is known with high accuracy. 2. The observer measures the magnified reticle image size y'' with the microscope. The reticle image size is y''/m, where m is the microscope magnification. It depends on the objective and eyepiece characteristics. The focal length is deduced from: = = .. c. Uncertainty analysis The result uncertainty depends on the accuracy with which the angular size of the reticle is known. It is also related to the reading uncertainty.
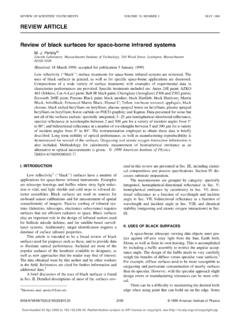
5 Measurements should be repeated several times, and the standard deviation x of the set of measurement is computed. Assuming that all sources of error are independent, error estimation is obtained with the root sum square technique: " " . = f +.. + , and = +. " ". 3. Nodal slide method a. Principle Let be assumed that the lens is in the air. Thus, its rear principal point is superimposed with its rear nodal point. The nodal slide method uses the property that the image is not shifted when the lens is rotated about its rear nodal point. b. Measurement Figure 4: nodal points Here is a setup example: Figure 5: nodal slide setup 3. The lens focal length is deduced from two configurations: The lens rear vertex is on the rotation axis, and the microscope is positioned such that it focuses on this rear vertex.
6 The lens nodal point is on the rotation axis, and the microscope focuses on the rear focal point. The lens is at the right position if the image does not shift when the lens is rotated. The microscope position is marked for both configurations, and the lens focal length results from the difference in position of the microscope. c. Uncertainty analysis The uncertainty of this measurement is mainly due to the microscope and lens position error. It also depends on the accuracy of the position reading device. The depth of focus depends on the microscope objective aperture, because of diffraction: $ *. !"" ~ %&' , where ()~ +/#. is the microscope objective's numerical aperture. A short focal length lens has a short depth of focus, and position reading is more precise than with a longer focal length lens.
7 The observer should repeat the measurements many times in order to evaluate the positioning error. A root sum square of the different sources of errors also gives an estimation of the measurement uncertainty, since all sources of error are independent. 4. Cornu method a. Principle This technique is based on Newton's formula: = /) 00000 = / 1. 0000 / ) 00000 /1 . 00000, Where A is the front vertex of the lens, A' is the image of A through the lens, B is the rear vertex, and B' is the image of B through the lens. b. Measurement o The first step is to measure the reticle image position which is located at the test lens focal plane. Then the microscope is translated in order to focus on the lens rear vertex B, and on the image of the front vertex A'.
8 Figure 6: Cornu method first measurement. 4. 00000 and The microscope position is marked for each measurement. At this stage, / 1. 00000 are known. / ) . o The lens is flipped, and similar measurements are performed, in order to locate the front focal point F, the front vertex A, and the image of the rear vertex B'. Figure 7 : Cornu method second measurement Now /)0000 and 00000. /1 are known, and Newton's formula can be used to calculate the lens focal length . c. Uncertainty analysis Sources of error are the same as with the nodal slide method: o Diffraction $. The depth of focus is related to the diffraction such that: !"" ~ %&' , where NA is the microscope objective's numerical aperture. o Reading error 5. Moir deflectometry Interference between two waves diffracted by two different gratings creates a Moir.
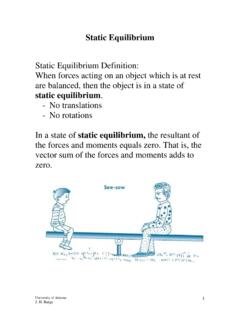
9 Pattern. For a converging lens, two gratings are placed between the lens and its rear focal plane. It can be shown that the focal length is functions of the second grating pitch p, the aperture size a, the distance between the two gratings , and the 2 . number of observed fringes N: = 3%. Figure 8: Moir deflectometry The error measurement comes from the counting *. of fringes. Assuming that 4 of a fringe is be resolved, the focal length can be measured with about accuracy, according to the authors of this method. 5. 6. Talbot interferometry This technique uses the Talbot effect: the image of a coherent wave with 2D periodic amplitude distribution, incident upon a diffraction grating, is regularly repeated. The distance between each self-image is the Talbot length .
10 If the wave interferes with another wave diffracted by a grating with a different spatial period, it creates a Moir . pattern. This is Talbot interferometry. The self-images of a diffracted wave are imaged by the test lens. Another diffraction grating is placed in the lens image space, creating a Moir pattern for each image with a different spatial period of the fringes. It can be shown that the lens focal length is related to the distance between different Moir images. According to the author, this method gives the focal length value with less than 1% accuracy. 7. Fizeau interferometry The length focal length is calculated using the following formula: 1 1 1. + =. 6 7. U and V are measured from the principal planes. Ru and Rv are measured from the lens vertexes.