Transcription of Printed on July 24, 2018 RBC European Equity Fund
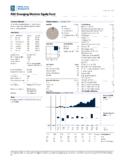
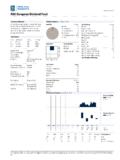
1 Printed on July 24, 2018. RBC European Equity fund Investment Objective Portfolio Analysis as of June 30, 2018. To provide long-term capital growth by investing in Equity Asset Mix % Assets Top 25 Holdings % Assets securities of European companies in order to provide Cash Unilever PLC exposure to growth opportunities in the European Fixed Income RELX NV economy and diversification benefits beyond North Canadian Equity Royal Dutch Shell PLC Class A America. US Equity Novo Nordisk A/S B International Equity London Stock Exchange Group PLC fund Details Other Diageo PLC Series Load Structure Currency fund Code Heineken NV A No Load CAD RBF457 Ryanair Holdings PLC ADR Adv Deferred Sales CAD RBF848 Equity Style Equity Statistics Paddy Power Betfair PLC Adv Front End CAD RBF748 P/B Ratio LVMH Moet Hennessy Louis Vuitton SE Large Mid Adv Low Load CAD RBF174 P/E Ratio SAP SE T5 No Load CAD RBF5457 Sampo Oyj A Avg.
2 Mkt Cap. $B Schroders PLC Small Inception Date July 1987 Bayer AG Total fund Assets $Mil 6, Roche Holding AG Dividend Right Cert. Series A NAV $ Value Blend Growth Lloyds Banking Group PLC Series A MER % Sage Group (The) PLC Benchmark MSCI Europe Total Return Top 5 Sectors % Equity CRH PLC Net Index ($C). Financials Burberry Group PLC Industrials Henkel AG & Co. Pfd Income Distribution Annually Consumer Discretionary Barratt Developments PLC Capital Gains Distribution Annually Consumer Staples Ashtead Group PLC Health Care Grifols SA A Sales Status Open Min. Investment $ 500 Continental AG Subsequent Investment $ 25 Geographic Allocations % Assets Sika AG Bearer Shs United Kingdom Total % of Top 25 Holdings fund Category European Equity Germany Total Number of Stock Holdings 51.
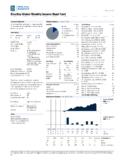
3 Netherlands Total Number of Bond Holdings 0. Management Company RBC Global Asset Denmark Total Number of Other Holdings 1. Management Inc. Switzerland Total Number of Holdings 52. Web Site Performance Analysis as of June 30, 2018. 16 Growth of $10,000. Notes 14 Series A. This is a continuing fund resulting from a merger 12 $13,126. effective June 27, 2014. 10. 8. 6. 4. 40 Calendar Returns %. Series A. 20. 0. -20. -40. 2008 2009 2010 2011 2012 2013 2014 2015 2016 2017 YTD. fund 3rd 4th 2nd 3rd 3rd 1st 3rd 1st 4th 1st 4th Quartile 1 Mth 3 Mth 6 Mth 1 Yr 3 Yr 5 Yr 10 Yr Since Incep. Trailing Return %. fund 3rd 2nd 4th 3rd 3rd 2nd 3rd Quartile 177 177 175 173 117 77 55 No. of Funds in Category 2018. Morningstar Research Inc. All Rights Reserved. The information contained herein: (1) is proprietary to Morningstar and/or its content providers; (2) may not be copied or distributed; and (3) is not warranted to be accurate, complete or timely.
4 Neither Morningstar nor its content providers are responsible for any damages or losses arising from any use of this information. Past performance is no guarantee of future results. These pages are not complete without the disclosure page. Printed on July 24, 2018. RBC European Equity fund Management Overview Manager Bios Performance Analysis Cont'd as of June 30, 2018. Dominic Wallington Distributions ($)/Unit YTD* 2017 2016 2015 2014 2013 2012 2011 2010 2009 2008. RBC Global Asset Management (UK) Limited Total Distributions Dominic has worked in the investment industry since Interest 1991 and has been a portfolio manager since 1993. Prior Dividends . to joining RBC Global Asset Management (UK) Limited, Capital Gains . he worked for Invesco Perpetual. Between 2002 and July Return Of Capital.
5 2007, Dominic ran several Continental European Equity funds for individual investors and institutions. He has a Best/Worst Periods % Ended 1 Yr Ended 3 Yr Ended 5 Yr Ended 10 Yr Masters in Finance and Investment from the University of Best 5-1998 2-2000 7-1998 2-2004 Exeter. Dominic also holds the Securities Institute Worst 10-2008 3-2003 5-2012 6-2010 Diploma and is a Fellow of the Securities Institute. Average No. of Periods 289 265 241 181. David Lambert Pct. Positive RBC Global Asset Management (UK) Limited * Distributions are characterized into income type at year-end. David is a Portfolio Manager with the European Equity team of RBC Global Asset Management (UK) Limited. He Quarterly Commentary as at June 30, 2018. is part of a veteran team that strives to identify superior investment opportunities while minimizing risks.
6 David European markets had their strongest quarter began his career with the firm in 1999 as a Quantitative since Q1 2017, which resulted in the recovery of Data seems to suggest further earnings growth is Analyst and became a Portfolio Manager in 2003. He most first-quarter losses. This occurred despite possible while, from a valuation perspective, graduated from Loughborough University with a First geopolitical events continuing to create volatility market price-to-earnings ratios are close to fair Class BSc (Hons) degree in Mathematics and is an across global markets. value and dividend yields in all markets look Associate of the UK Society of Investment Professionals attractive relative to bond yields. (CFA UK). The protectionist trade policies pursued by President Trump, which has crystallized in a At a sector level, our position in Energy was the nascent trade war with China, was accompanied standout positive contributor whereas the position by the installation of a populist political coalition in Financials was an offsetting negative.
7 In Italy with promises to boost government spending. Brexit-centred uncertainty persisted The largest individual contributor was our position from both a political and business perspective, in Royal Dutch Shell plc, followed by the second- with economic growth in the United Kingdom continuing to lag the rest of Europe. largest contributor, Burberry Group PLC. The largest detractors were Pandora Jewelry A/S and European macro data plateaued after first-quarter Continental AG. declines and, at their current level, are still consistent with double-digit earnings growth. While we are, as always, cognizant of the wider Leading indicators have begun to roll over; macro environment, our focus remains on the although this is not necessarily bearish for the discipline of long-term investing in companies with market as a whole, it can have implications for strong competitive positions, low capital intensity, sector rotation.
8 Sustainable and/or improving profitability. 2018. Morningstar Research Inc. All Rights Reserved. The information contained herein: (1) is proprietary to Morningstar and/or its content providers; (2) may not be copied or distributed; and (3) is not warranted to be accurate, complete or timely. Neither Morningstar nor its content providers are responsible for any damages or losses arising from any use of this information. Past performance is no guarantee of future results. These pages are not complete without the disclosure page. Printed on July 24, 2018. RBC European Equity fund Disclosure RBC Funds, BlueBay Funds, PH&N Funds and implied, are made by RBC GAM, its affiliates RBC Corporate Class Funds are offered by or any other person as to its accuracy, The fund profile is provided for informational RBC Global Asset Management Inc.
9 And completeness or correctness. All opinions purposes only. Particular investments and/or distributed through authorized dealers. and estimates constitute RBC GAM's trading strategies should be evaluated judgment as of the date of this document, are relative to each individual's investment Commissions, trailing commissions, subject to change without notice and are objectives. The information contained in the management fees and expenses all may be provided in good faith but without legal associated with mutual fund investments. responsibility. The Top Ten/25 Holdings may fund profile is not, and should not be Please read the prospectus or fund Facts change due to ongoing portfolio transactions construed as, investment or tax advice. You document before investing. Except as within the fund .
10 The Prospectus and other should not act or rely on the information otherwise noted, the indicated rates of return information about the underlying investment contained in the fund profile without seeking are the historical annual compounded total funds are available at the advice of an appropriate professional returns including changes in unit value and advisor. reinvestment of all distributions and do not MER (%) for RBC Funds, PH&N Funds and take into account sales, redemption, BlueBay Funds is based on actual expenses Quartile rankings are determined by distribution or optional charges or income for the full year period, January 1 to Morningstar Research Inc., an independent taxes payable by any unitholder that would December 31, 2017, expressed on an have reduced returns.