Transcription of Printed on July 24, 2018 RBC Global Growth & …
1 Printed on July 24, 2018 2018 . Morningstar Research Inc. All Rights Reserved. The information contained herein: (1) is proprietary to Morningstar and/or its content providers; (2) may not be copied or distributed; and (3) is not warranted to be accurate, complete ortimely. Neither Morningstar nor its content providers are responsible for any damages or losses arising from any use of this information. Past performance is no guarantee of future results. These pages are not complete without the Global Growth & Income FundInvestment ObjectiveTo provide a combination of capital Growth and modestincome. The fund invests primarily in a diversifiedportfolio of equity and fixed-income securities fromanywhere around the world either directly or indirectlythrough investment in other mutual funds managed byRBC GAM or an DetailsSeriesLoad StructureCurrencyFund CodeANo LoadCADRBF472 ANo LoadUSDRBF470 AdvFront EndCADRBF6472 AdvLow LoadCADRBF032 AdvLow LoadUSDRBF4470 Adv T5 Front EndCADRBF713 Adv T5 Low LoadCADRBF030T5No LoadCADRBF512 Inception DateJanuary 2016 Total Fund Assets $ A NAV $ A MER % MSCI World Net TotalReturn Index (C$) FTSE World GovBond Index (C$ hedged) ICE BofA MerrillLynch High Yield BB-BIndex (C$ hedged) JPM EMBI GlobalDiversified Index (C$hedged)Income DistributionQuarterlyCapital Gains DistributionAnnuallySales StatusOpenMin.
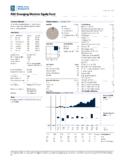
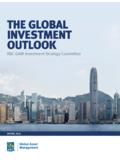
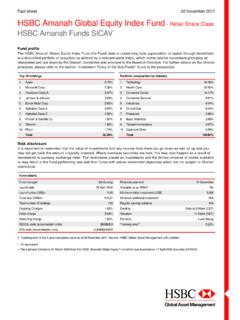
2 Investment $500 Subsequent Investment $25 Fund CategoryGlobal Equity BalancedManagement CompanyRBC Global AssetManagement Analysis is in CAD and for CAD series Afund (RBF472).Portfolio Analysisas of June 30, 2018 Asset Mix% StyleValueBlendGrowthLargeMidSmallStatis ticsP/B Mkt Cap. $ 5 Sectors% IncomeBreakdown%Govt. & Term tomaturity (Yrs) Duration(Yrs) to 25 Holdings% AssetsRBC Global Dividend Growth Global Equity Focus Global Bond Global Corporate Bond Emerging Markets Equity Global High Yield Bond US Mid-Cap Value Equity European Mid-Cap Equity Global Monthly Income Bond Emerging Markets Foreign Exchange % of Top 25 Number of Portfolio Holdings11 Total Number of Stock Holdings253 Total Number of Bond Holdings6,021 Total Number of Other Holdings241 Total Number of Underlying Holdings6,515 Performance Analysis as of June 30, 20189101112131415 Growth of $10,000 Series A$12, 2009 2010 2011 2012 2013 2014 2015 2016 Returns %Series AFundQuartile1 Mth3 Mth6 Mth1 Yr3 Yr5 Yr10 YrSince Return % Quartile1086108210581029728491256 No.
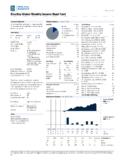
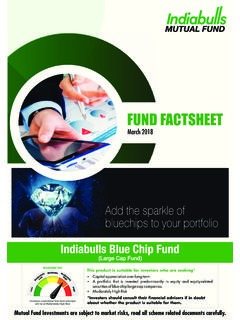
3 Of Funds in CategoryPrinted on July 24, 2018 2018 . Morningstar Research Inc. All Rights Reserved. The information contained herein: (1) is proprietary to Morningstar and/or its content providers; (2) may not be copied or distributed; and (3) is not warranted to be accurate, complete ortimely. Neither Morningstar nor its content providers are responsible for any damages or losses arising from any use of this information. Past performance is no guarantee of future results. These pages are not complete without the Global Growth & Income FundManagement OverviewManager BiosSarah RiopelleRBC Global Asset Management Riopelle is Vice President and Senior PortfolioManager, Investment Solutions. Sarah began herinvestment career in 1996. She is a member of the RBCI nvestment Strategy Committee and is responsible forthe firm's Portfolio Solutions. Sarah has a Bachelor ofCommerce in Finance and International Managementfrom the University of Ottawa and is a CFA Analysis Cont'd as of June 30, 2018 Distributions ($)/UnitYTD*2017201620152014201320122011 201020092008 Total Distributions Interest Dividends Capital Gains Return Of Capital EndedEndedEndedEnded4-2017 1-2017 Best/Worst Periods %1 Yr3 Yr5 Yr10 No.
4 Of Periods18 Pct. * Distributions are characterized into income type at Commentary as at June 30, 2018 The second quarter of 2018 was marked byescalating trade tensions between the andmuch of the world, as President Trump made goodon his promise to institute billions of dollars intariffs. Against this backdrop, economicgrowth accelerated, while the expansion appearedto slow in Europe and emerging Fund s overweight position in equities andunderweight position in fixed income had anegative impact on performance. Globalgovernment bonds were mixed, with finishing the period essentially flatwhile German and Japanese bonds rose. Canadianbonds posted modest gains during the period, asthe trade conflict and slowing Global growthcapped yields on Government of Canada were held back by exposure to the RBCG lobal High Yield Bond Fund and the RBCE merging Markets Foreign Exchange equity markets continued to fluctuate in thequarter as the trade conflict moved beyond the and China to engulf Europe and equity prices slumped while Canadianstocks rebounded, supported by rising oil Fund s performance benefited from exposureto the RBC Global Equity Focus Fund and the RBCG lobal Dividend Growth Growth slowed in the first half of 2018 ,but remains at its most solid since the financialcrisis amid fiscal stimulus and business andconsumer optimism.
5 The portfolio managerexpects continued expansion, encouraging centralbanks to nudge rates higher and acting as aheadwind for bond returns. As a result, the Fundremains underweight fixed income, but less sothan at previous points in the cycle. Stocks offermore attractive prospects. The portfolio managerhas been moderating risk-taking but the potentialupside in earnings still justifies a mild overweightin on July 24, 2018 2018 . Morningstar Research Inc. All Rights Reserved. The information contained herein: (1) is proprietary to Morningstar and/or its content providers; (2) may not be copied or distributed; and (3) is not warranted to be accurate, complete ortimely. Neither Morningstar nor its content providers are responsible for any damages or losses arising from any use of this information. Past performance is no guarantee of future results. These pages are not complete without the Global Growth & Income FundDisclosureRBC Funds, BlueBay Funds, PH&N Funds andRBC Corporate Class Funds are offered byRBC Global Asset Management Inc.
6 Anddistributed through authorized , trailing commissions,management fees and expenses all may beassociated with mutual fund read the prospectus or Fund Factsdocument before investing. Except asotherwise noted, the indicated rates of returnare the historical annual compounded totalreturns including changes in unit value andreinvestment of all distributions and do nottake into account sales, redemption,distribution or optional charges or incometaxes payable by any unitholder that wouldhave reduced returns. Mutual funds are notguaranteed or covered by the CanadianDeposit Insurance Corporation or by any othergovernment deposit insurer. For moneymarket funds, there can be no assurancesthat the fund will be able to maintain its netasset value per unit at a constant amount orthat the full amount of your investment in thefund will be returned to you. The value ofmutual funds change frequently and pastperformance may not be document has been compiled by RBCG lobal Asset Management Inc.
7 (RBC GAM)from sources believed to be reliable, but norepresentations or warranty, express orimplied, are made by RBC GAM, its affiliatesor any other person as to its accuracy,completeness or correctness. All opinionsand estimates constitute RBC GAM'sjudgment as of the date of this document, aresubject to change without notice and areprovided in good faith but without legalresponsibility. The Top Ten/25 Holdings maychange due to ongoing portfolio transactionswithin the fund. The Prospectus and otherinformation about the underlying investmentfunds are available at (%) for RBC Funds, PH&N Funds andBlueBay Funds is based on actual expensesfor the full year period, January 1 toDecember 31, 2017, expressed on anannualized (%) for RBC Corporate Class Funds isbased on actual expenses for the full yearperiod, April 1, 2017 to March 31, H and Series I are not available forpurchase by new investors. Existinginvestors who hold Series H or Series I unitscan continue to make additional investmentsinto the same series of the funds they are only used to illustrate the effectsof the compound Growth rate and do notreflect future values of any fund or returns oninvestment of any fund profile is provided for informationalpurposes only.
8 Particular investments and/ortrading strategies should be evaluatedrelative to each individual s investmentobjectives. The information contained in thefund profile is not, and should not beconstrued as, investment or tax advice. Youshould not act or rely on the informationcontained in the fund profile without seekingthe advice of an appropriate rankings are determined byMorningstar Research Inc., an independentresearch firm, based on categoriesmaintained by the Canadian InvestmentFunds Standards Committee (CIFSC). Quartilerankings are comparisons of the performanceof a fund to other funds in a particularcategory and are subject to change quartiles divide the data into four equalsegments expressed in terms of rank (1, 2, 3or 4). This is the Morningstar quartile rankingof Series A and F units of the Fund as of June30, 2018 . / Trademark(s) of Royal Bank of under licence. RBC Global AssetManagement Inc. 2018