Transcription of Printed on July 24, 2018 RBC Life Science and …
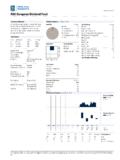
1 Printed on January 23, 2019 2019. Morningstar Research Inc. All Rights Reserved. The information contained herein: (1) is proprietary to Morningstar and/or its content providers; (2) may not be copied or distributed; and (3) is not warranted to be accurate, complete ortimely. Neither Morningstar nor its content providers are responsible for any damages or losses arising from any use of this information. Past performance is no guarantee of future results. These pages are not complete without the Compliant PDFRBC life Science and Technology FundInvestment ObjectiveTo provide long-term capital growth by investingprimarily in equity securities of companies whosebusinesses relate to life sciences and technology and areexpected to benefit from scientific and DetailsSeriesLoad StructureCurrencyFund CodeANo LoadCADRBF274 Inception DateJuly 1995 Total Fund Assets $ A NAV $ A MER % S&P 500 Health Care50% S&P 500 Info Tech(measured in C$)Income DistributionAnnuallyCapital Gains DistributionAnnuallySales StatusOpenMin.
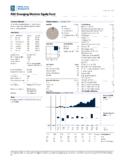
2 Investment $500 Subsequent Investment $25 Fund CategoryUS EquityManagement CompanyRBC Global AssetManagement Analysisas of December 31, 2018 Asset Mix% StyleValueBlendGrowthLargeMidSmallEquity StatisticsP/B Mkt Cap. $ Equity Sectors% EquityInformation 25 Holdings% AssetsMicrosoft Inc & Inc Group Inc Class Systems Inc & Co Fisher Scientific Holdings Squibb Lilly and PLC % of Top 25 Number of Stock Holdings123 Total Number of Bond Holdings0 Total Number of Other Holdings2 Total Number of Holdings125 Performance Analysis as of December 31, 20180102030405060 Growth of $10,000 Series A$31, Returns %Series AFundQuartile1 Mth3 Mth6 Mth1 Yr3 Yr5 Yr10 YrSince Return % Quartile15291520147014311052701285 No. of Funds in CategoryPrinted on January 23, 2019 2019.
3 Morningstar Research Inc. All Rights Reserved. The information contained herein: (1) is proprietary to Morningstar and/or its content providers; (2) may not be copied or distributed; and (3) is not warranted to be accurate, complete ortimely. Neither Morningstar nor its content providers are responsible for any damages or losses arising from any use of this information. Past performance is no guarantee of future results. These pages are not complete without the life Science and Technology FundManagement OverviewManager BiosRob CavalloRBC Global Asset Management is a Portfolio Manager with the North Americanequities team. Rob joined the firm in 2012 as a Globalequities analyst with a focus on analyzing companieswithin the Health Care and Consumer sectors. Robearned a Bachelor of Commerce degree at the Universityof Toronto and is a CFA MontanariRBC Global Asset Management Montanari is Vice President and SeniorPortfolio Manager, North American Equities.
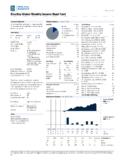
4 Marcellobegan his career in the investment industry in 1992. Heearned a Bachelor of Commerce degree in finance fromConcordia University and is a CFA Analysis Cont'd as of December 31, 2018 Distributions ($)/Unit2018*201720162015201420132012201 1201020092008 Total Distributions Interest Dividends Capital Gains Return Of Capital EndedEndedEndedEnded2-20002-20008-200011 -20189-20012-20038-20058-2010 Best/Worst Periods %1 Yr3 Yr5 Yr10 of Periods270246222162 Pct. * Final distribution attribution (interest, dividends, capital gains and return of capital) for 2018 will be reflected withJanuary month-end Commentary as at December 31, stocks significantly corrected in the fourthquarter of 2018, with the healthcare sectorperforming slightly better than the broad market,and the technology sector being the second-worstperformer.
5 From April to September, stocksenjoyed a stretch of strong returns, drivenprimarily by earnings growth. However, volatilityre-emerged in October, sparked by rising interestrates in the United States, as higher rates have thepotential to generate headwinds to economic andearnings lingering concerns about deceleratinggrowth, the recent market pull-back has arguablypriced in most apparent challenges. For investors,reduced stock-market valuations mean that futurereturns will not be entirely reliant on the fourth quarter, a mild overweight in NVIDIA stock detracted from relative performance amidconcerns over gaming growth, a large segment forNVIDIA. Conversely, the fund s position inGuardant Health was a boost to Health, a cancer-diagnostic company,saw its stock jump after its IPO in October and hasexperienced good performance in since our base case is for stocks to rise verymodestly over the next year, several scenarioscould lead to different outcomes.
6 A policy mistakeby the Federal Reserve Board (Fed), if it raisesrates too fast, or an escalation of protectionistmoves by the Trump administration, if it imposesmore tariffs or raises the tariff rate are the mostlikely causes of a potential downturn, as bothcould bring a halt to the expansion. Technologyhardware in particular could experience furtherweakness should relations continue the upside scenario, the expansion wouldremain intact through 2021, perhaps because theFed pauses its rate-hike cycle soon or the Trumpadministration comes to a trade agreement on January 23, 2019 2019. Morningstar Research Inc. All Rights Reserved. The information contained herein: (1) is proprietary to Morningstar and/or its content providers; (2) may not be copied or distributed; and (3) is not warranted to be accurate, complete ortimely.
7 Neither Morningstar nor its content providers are responsible for any damages or losses arising from any use of this information. Past performance is no guarantee of future results. These pages are not complete without the life Science and Technology FundDisclosureRBC Funds, BlueBay Funds, PH&N Funds andRBC Corporate Class Funds are offered byRBC Global Asset Management Inc. anddistributed through authorized , trailing commissions,management fees and expenses all may beassociated with mutual fund read the prospectus or Fund Factsdocument before investing. Except asotherwise noted, the indicated rates of returnare the historical annual compounded totalreturns including changes in unit value andreinvestment of all distributions and do nottake into account sales, redemption,distribution or optional charges or incometaxes payable by any unitholder that wouldhave reduced returns.
8 Mutual funds are notguaranteed or covered by the CanadianDeposit Insurance Corporation or by any othergovernment deposit insurer. For moneymarket funds, there can be no assurancesthat the fund will be able to maintain its netasset value per unit at a constant amount orthat the full amount of your investment in thefund will be returned to you. The value ofmutual funds change frequently and pastperformance may not be document has been compiled by RBCG lobal Asset Management Inc. (RBC GAM)from sources believed to be reliable, but norepresentations or warranty, express orimplied, are made by RBC GAM, its affiliatesor any other person as to its accuracy,completeness or correctness. All opinionsand estimates constitute RBC GAM'sjudgment as of the date of this document, aresubject to change without notice and areprovided in good faith but without legalresponsibility.
9 The Top Ten/25 Holdings maychange due to ongoing portfolio transactionswithin the fund. The Prospectus and otherinformation about the underlying investmentfunds are available at (%) for RBC Funds, PH&N Funds andBlueBay Funds is based on actual expensesfor the preceding calendar year or mostrecent half-year period ended June 30expressed on an annualized basis, dependingon availability of data at the time (%) for RBC Corporate Class Funds isbased on actual expenses for the precedingfull year period ended March 31 or half-yearperiod ended September 30 expressed on anannualized basis, depending on availability ofdata at the time of H and Series I are not available forpurchase by new investors. Existinginvestors who hold Series H or Series I unitscan continue to make additional investmentsinto the same series of the funds they are only used to illustrate the effectsof the compound growth rate and do notreflect future values of any fund or returns oninvestment of any fund profile is provided for informationalpurposes only.
10 Particular investments and/ortrading strategies should be evaluatedrelative to each individual s investmentobjectives. The information contained in thefund profile is not, and should not beconstrued as, investment or tax advice. Youshould not act or rely on the informationcontained in the fund profile without seekingthe advice of an appropriate rankings are determined byMorningstar Research Inc., an independentresearch firm, based on categoriesmaintained by the Canadian InvestmentFunds Standards Committee (CIFSC). Quartilerankings are comparisons of the performanceof a fund to other funds in a particularcategory and are subject to change quartiles divide the data into four equalsegments expressed in terms of rank (1, 2, 3or 4). This is the Morningstar quartile rankingof Series A and F units of the Fund as ofDecember 31, 2018.