Transcription of RBC Global Equity Fund
1 Printed on April 25, 2018 2018. Morningstar Research Inc. All Rights Reserved. The information contained herein: (1) is proprietary to Morningstar and/or its content providers; (2) may not be copied or distributed; and (3) is not warranted to be accurate, complete ortimely. Neither Morningstar nor its content providers are responsible for any damages or losses arising from any use of this information. Past performance is no guarantee of future results. These pages are not complete without the Global Equity FundInvestment ObjectiveTo provide long-term capital growth.
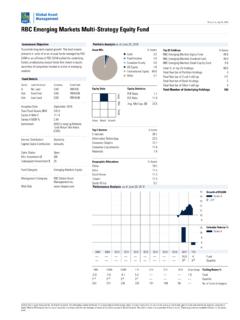
2 The fund investsprimarily in Equity securities of a diversified mix ofcompanies operating in various countries around theworld across a range of DetailsSeriesLoad StructureCurrencyFund CodeANo LoadCADRBF477 ANo LoadUSDRBF412 AdvFront EndCADRBF6737 AdvLow LoadCADRBF4077 AdvLow LoadUSDRBF4412T5No LoadCADRBF5477 Inception DateMarch 2014 Total Fund Assets $ A NAV $ A MER % World Total ReturnNet Index (C$)Income DistributionAnnuallyCapital Gains DistributionAnnuallySales StatusOpenMin. Investment $500 Subsequent Investment $25 Fund CategoryGlobal EquityManagement CompanyRBC Global AssetManagement Analysis is in CAD and for CAD series Afund (RBF477).
3 Portfolio Analysisas of March 31, 2018 Asset Mix% StyleValueBlendGrowthLargeMidSmallEquity StatisticsP/B Mkt Cap. $ 5 Sectors% Allocations% AssetsUnited 25 Holdings% AssetsUnitedHealth Group Resources Estee Lauder Companies Inc Class Semiconductor Manufacturing Companies Holding AG Dividend Right Post Inc Republic Financial InBev NV Group Group Inc Industries Hotels Group International Ltd Class % of Top 25 Number of Stock Holdings51 Total Number of Bond Holdings0 Total Number of Other Holdings1 Total Number of Holdings52 Performance Analysis as of March 31.
4 20188101214161820 Growth of $10,000 Series A$16,760-80816242008 2009 2010 2011 2012 2013 2014 Returns %Series AFundQuartile1 Mth3 Mth6 Mth1 Yr3 Yr5 Yr10 YrSince Return % Quartile17811763166315631059754404 No. of Funds in CategoryPrinted on April 25, 2018 2018. Morningstar Research Inc. All Rights Reserved. The information contained herein: (1) is proprietary to Morningstar and/or its content providers; (2) may not be copied or distributed; and (3) is not warranted to be accurate, complete ortimely.
5 Neither Morningstar nor its content providers are responsible for any damages or losses arising from any use of this information. Past performance is no guarantee of future results. These pages are not complete without the Global Equity FundManagement OverviewManager BiosHabib SubjallyRBC Global Asset Management (UK) LimitedHabib has served as Head of Global Equities and leaderof this team since 2006. Prior to that, he held positions atCredit Suisse (Head of Small & Mid Cap Research),Invesco (Head of Global Equities), Merrill LynchInvestment Managers (Head of North American andGlobal Equities Research, and Manager, Mercury GlobalTitans Fund) and Ernst & Young.
6 Habib holds a BSc (Hons)from the London School of Economics and the CharteredAccountant and ASIP Analysis Cont'd as of March 31, 2018 Distributions ($)/UnitYTD*2017201620152014201320122011 201020092008 Total Distributions Interest Dividends Capital Gains Return Of Capital EndedEndedEndedEnded7-201510-2017 2-20163-2018 Best/Worst Periods %1 Yr3 Yr5 Yr10 No. of Periods3713 Pct. * Distributions are characterized into income type at Commentary as at March 31, cosmetics producer, Est e Lauder CompaniesInc.
7 , was the biggest contributor to the Fund srelative returns in Q1. The stock has had a verystrong run with demand from China, e-commerceand travel retail driving sales growth. onlineretailer and cloud-computing provider, Inc., returned almost 24% over the quarterafter strong growth and results. The company alsobenefited from the announcement of new businessinitiatives, such as health-care distribution. NidecCorp., the Japanese manufacturer of precisionmotors, also performed gaming company, Paddy Power Betfair plc,was the biggest detractor from relative returns inQ1.
8 Stock performance was weaker after changesto senior management and a negative responsefrom some investors to the company s increasedinvestment plans, which will hit shorter-termrevenues. manufacturer of floorings, MohawkIndustries, fell on the back of reduced guidanceand increased capital spending. We believe thelatter will be positive for Mohawk over the first quarter of 2018 started strongly, butfragmented in February with markets selling off inconcert, driven by volatility trade unwinds andvaluation concerns.
9 March was also negative withconcerns around the re-emergence ofprotectionism, especially between the andChina. There was also a reappraisal of valuationsin the burgeoning Technology sector in light ofsome firms cavalier attitudes toward customerdata. The dollar was generally weak, despitethe stimulatory potential of president Trump s taxcuts, a strong economy and rising interest always, the RBC Global Equity team remainscommitted to the discovery of companies that wedeem to be future success stories. We areconstantly searching for compelling long-termopportunities at the right valuations while avoidingbusinesses that are overvalued or optically cheap,but fundamentally on April 25, 2018 2018.
10 Morningstar Research Inc. All Rights Reserved. The information contained herein: (1) is proprietary to Morningstar and/or its content providers; (2) may not be copied or distributed; and (3) is not warranted to be accurate, complete ortimely. Neither Morningstar nor its content providers are responsible for any damages or losses arising from any use of this information. Past performance is no guarantee of future results. These pages are not complete without the Global Equity FundDisclosureRBC Funds, BlueBay Funds, PH&N Funds andRBC Corporate Class Funds are offered byRBC Global Asset Management Inc.