Transcription of Save the Pies for Dessert - Perceptual Edge
1 Copyright 2007 Stephen Few, Perceptual EdgePage 1 of 14 Save the Pies for DessertStephen Few, Perceptual EdgeVisual Business Intelligence NewsletterAugust 2007perceptualedgeNot long ago I received an email from a colleague who keeps watch on business intelligence vendors and rates their products. She was puzzled that a particular product that I happen to like did not support pie charts, a feature that she assumed was basic and indispensable. Be-cause of previous discussions between us, when I pointed out ineffective graphing practices that are popular in many BI products, she wondered if there might also be a problem with pie charts. Could this vendor s omission of pie charts be intentional and justifi ed?
2 I explained that this was indeed the case, and praised the vendor s design team for their good sits the friendly pie chart:Its slices are upturned into an inviting smile. Its simple charm is beloved by all but a few, welcomed almost everywhere; familiar and rarely threatening. Of all the graphs that play major roles in the lexicon of quantitative communication, however, the pie chart is by far the least effective. Its colorful voice is often heard, but rarely understood. It mumbles when it in the graph design course that I teach is more controversial than what I say about pie charts. People love them dearly and are often shocked to hear me speak ill of them. When students in my course don t raise objections immediately, despite the shock on their faces, they often approach me during a break to defend their frequent use of pies.
3 Many, I suspect, respond this way because they can t imagine how they could possibly convince people where they work to abandon their beloved charts are not without their strengths. The primary strength of a pie chart is the fact that the message part-to-whole relationship is built right into it in an obvious way. Children learn fractions by looking at pies sliced in various ways and decoding the ratio (quarter, half, three quarters, etc.) of each slice. A bar graph doesn t have this obvious purpose built into its design. Not as directly, anyway, but it can be built into bar graphs in a way that prompts people to think in terms of a whole and its parts. This can be accomplished in part by using a percentage scale.
4 It is easy and natural to think in terms of various percentages in relation to Copyright 2007 Stephen Few, Perceptual EdgePage 2 of 14the whole of 100%. Seeing a bar extend to 25% along a quantitative scale conveys a part-to-whole relationship only slightly less effectively than a pie chart with a quarter slice, especially if the bar graph s title declares that it displays the parts of some total (for example, Regional Breakdown of Total Revenue ). Despite the obvious nature of a pie charts message, bar graphs provide a much better means to compare the magnitudes of each part. Pie charts only make it easy to judge the magnitude of a slice when it is close to 0%, 25%, 50%, 75%, or 100%. Any percentages other than these are diffi cult to discern in a pie chart, but can be accurately discerned in a bar graph, thanks to the quantitative me to illustrate.
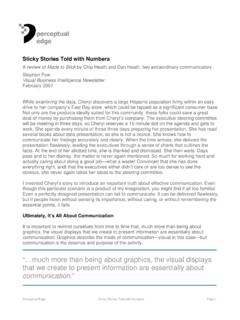
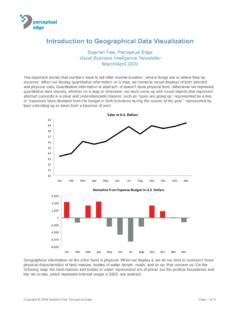
5 Here is a pie chart with six slices. Notice how easy it is to determine that the value of Company C (the green slice) is 25%, one quarter of the ACompany BCompany CCompany DCompany ECompany FNow notice how that even the green slice, which was easy to read as 25% above, is no longer as easy to recognize as 25% in the chart BCompany CCompany DCompany ACompany ECompany FNone of the values have changed. I simply sorted the slices by size. In the earlier example, our ability to decode the green slice at 25% was assisted by the fact that the green slice began at the 6 o clock position and extended neatly to the 9 o clock position. Positions at the extreme top, right, bottom, and left of a circle mark 90 degree intervals from one another, Copyright 2007 Stephen Few, Perceptual EdgePage 3 of 14each of which forms a right angle.
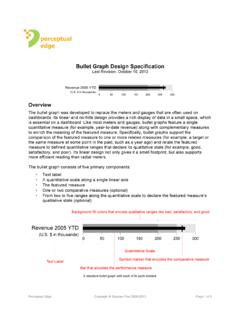
6 These four positions, as well as the 90 right angles that the intervals form, are quite familiar to our eyes and minds. In the second example, however, because the green slice now begins at a less recognizable position, the size of the slice is more diffi cult to might argue that this problem can be easily solved by labeling the values of each slice, as shown here:40%25%17%10%7%1%Company BCompany CCompany DCompany ACompany ECompany FWhy stop here? With this pie chart, we re forced to waste time bouncing our eyes back and forth between the legend on the right and the slices of the pie to fi gure out which slice repre-sents which company. We can solve this problem by directly labeling the slices with both the company names and the values, as shown here:Company B, 40%Company C, 25%Company D, 17%Co mp any A, 10%Co mp any E, 7%Co mp any F, 1%Do you realize what we have just done?
7 Because the pie chart was diffi cult to read, we added values so we wouldn t have to compare the sizes of the slices and we added direct Copyright 2007 Stephen Few, Perceptual EdgePage 4 of 14company labels so we wouldn t have to rely on a legend. We turned the pie chart into an awkwardly arranged equivalent of a table of labels and values. Here s the same information, arranged as a properly designed table:CompaniesPercentageCompany B40%Company C25%Company D17%Company A10%Company E7%Company F1%Total100%This information is much easier to read when presented in a table than it was when awk-wardly arranged around the periphery of the pie. So why use a graph at all? Why show a picture of the data if the picture can t be decoded and doesn t present the information more meaningfully?
8 The answer is: You shouldn t. Graphs are useful when a picture of the data makes meaningful relationships visible (patterns, trends, and exceptions) that could not be easily discerned from a table of the same what if we could display this same information in a graph that is easy to read; one that adds useful meaning by allowing us to compare the magnitudes of the values without label-ing them? Here s the same data displayed in a bar chart:0%5%10%15%20%25%30%35%40%Co mp any BCo mp any CCo mp any DCo mp any ACo mp any ECo mp any FCompany Percentages of Total Market ShareNow the values can be compared with relative ease and precision, relying solely on the graph, without labeling the values.
9 What value does this bar graph offer, compared to a table? In little more than a glance it paints a picture of the relationships between six com-panies regarding market share. Not only is their relative rank apparent, but the differences in value from one company to the next is readily available to our eyes. Could we construct this same picture in our heads from a table of the same values? Perhaps, but it would take a great deal of effort and time. Why bother when a graph can do the work for you and tell the story in a way that speaks directly to the high-bandwidth, parallel imaging processor in Copyright 2007 Stephen Few, Perceptual EdgePage 5 of 14your brain, which operates much faster than the part of your brain that handles text, which is needed to process tables?
10 Few people, if any, know more about graphs than William Cleveland, who has studied them extensively. Cleveland writes:When a graph is made, quantitative and categorical information is encoded by a display method. Then the information is visually decoded. This visual perception is a vital link. No matter how clever the choice of the information, and no matter how technologically impressive the encoding, a visualization fails if the decoding fails. Some display methods lead to effi cient, accurate decoding, and others lead to inef-fi cient, inaccurate decoding. It is only through scientifi c study of visual perception that informed judgments can be made about display methods. (William S. Cleveland, The Elements of Graphing Data, Hobart Press, 1994, p.)