Transcription of Shelf-Life Determination - IICAB Presentation
1 Pharmaceutical shelf life Determination :Findings of the PQRI stability shelf life Working GroupJames Schwenke, StatisticianApplied Research Consultants, LLCD etermining Release and Throughout Dating Potency Specifications:A Regulatory Policy WorkshopApril 21 22, 2015 Product Quality Research Institute (PQRI) stability shelf life Working Group PERSPECTIVE The Working Group is comprised of members from the R&D pharmaceutical industry including Statisticians, CMC and regulatory affairs as well as academia and FDA. The Working Group has been together since 2006 with a core of original members. Past members still keep in touch, with new members being added, together contributing a variety of experiences, opinions and philosophies. The statistical issues presented and discussed throughout this Presentation are not dependent on species, product type or formulation.
2 The statistical analysis is only dependent on the structure of the response data, where data are recorded from a set of registration batches or serials obtained under statistical control with each batch or serial independently measured over time. Product Quality Research Institute (PQRI) stability shelf life Working a consistent terminology for stability shelf lifeOn the shelf life of Pharmaceutical ProductsAAPS PharmSciTech, 2012(received Editor s Choice award) ICH/FDA methods for estimating shelf life methods based on a fixed batch mixed models for estimating shelf life incorporates random batch analyses extends shelf life inference to future mixed model analysis methods for estimating shelf life incorporating risk management balance risk for patients and industryApril 20 21, 2015 Applied Research Consultants, LLC1 Product Quality Research Institute (PQRI) stability shelf life Working Group True shelf life unknown property of the product sampling unit Estimated shelf life an estimate of the true shelf life Supported shelf life conservative (statistical)
3 Estimate of the true shelf life Maximum allowed shelf life maximum extrapolated shelf life by ICH Q1E decision tree Labeled shelf life producer s claim as printed on the package insert minimum of Supported and Maximum estimatesApril 20 21, 2015 Applied Research Consultants, LLC2 ICH/FDA GuidanceCurrent practices in shelf life Determination follow methods described in ICH/FDA guidance(ICH is the International Conference on Harmonisation) two ICH/FDA guidance documents are currently referenced for determining the shelf life for a pharmaceutical product ICH Q1A(R2): stability Testing of New Drug Substances and Products ICH Q1E:Evaluation for stability DataApril 20 21, 2015 Applied Research Consultants, LLC3 ICH/FDA Guidance ICH Q1A(R2) states The time period during which a drug product is expected to remain within the approved shelf life specification, provided that it is stored under the conditions defined on the container label.
4 Sounds reasonable but, trying to translate this into a mathematical statement to define a shelf life is a challenge unclear what is meant by drug product tablet or bottle of tablets single batch, registration batches or all future batchesApril 20 21, 2015 Applied Research Consultants, LLC4 ICH/FDA Guidance ICH Q1E states An appropriate approach to retest period or shelf life estimation is to analyze a quantitative attribute ( , assay, degradation products) by determining the earliest time at which the 95 percent confidence limit for the mean intersects the proposed acceptance criterion. gives an outline of a statistical methodology for estimating shelf life collect stability data fit regression line and construct 95% confidence interval shelf life is determined as the storage time where a confidence interval crosses acceptance criteriaApril 20 21, 2015 Applied Research Consultants, LLC5 ICH/FDA Guidance primary stability studies for registration require a minimum of 3 batches at least 2 pilot scale 1 can be smaller, but not lab scale may include more batches (discussion point)
5 Sampled data every 3 months for first year, every 6 months for second year and annually thereafter 0, 3, 6, 9, 12, 18, 24, 36, [48, 60] months response variables are stability limiting characteristics of the pharmaceutical productApril 20 21, 2015 Applied Research Consultants, LLC6 ICH/FDA Guidance ICH Guideline Q1E defines shelf life as The shelf life of a pharmaceutical product is the maximum time at which the true mean response of a stability limiting characteristic crosses the acceptance criterion. basis for current ICH/FDA shelf life estimation procedure focus is on the mean response implies a 50% risk to fail specification at shelf life probably does not meet patient expectations want to improve on this quality standard manage risk of both consumer and industryApril 20 21, 2015 Applied Research Consultants, LLC7 ICH/FDA shelf life ParadigmStability Limiting ResponseAcceptance CriterionStorage Time (Months)
6 ICH ProductShelf LifeProductDistributionApril 20 21, 2015 Applied Research Consultants, LLC8 stability Study Preliminary Statistical Analysis determine if a formal statistical analysis is necessary to estimate shelf life test the hypothesis that the drug product is stable over the duration of the stability study using ANOVA techniques, if no significant trend is detected in the stability data across storage time determine if confidence band about mean response stays within acceptance criteria if a significant trend is detected in the stability data model storage time profile using regression techniques determine storage time when confidence interval crossing acceptance criteriaApril 20 21, 2015 Applied Research Consultants, LLC9 ICH/FDA Statistical Methods for shelf life Estimation use of a simple linear (straight line) regression model is discussed in the ICH/FDA guidance assumed to characterize the storage time profile nonlinear models are more appropriate for some stability limiting characteristics quadratic models can be useful to approximate nonlinear models when sufficient data are not obtained to characterize the asymptote quadratic and nonlinear regression models are allowed by ICH/FDA guidance, but not discussed in detailApril 20 21, 2015 Applied Research Consultants, LLC10 ICH/FDA Statistical Methods for shelf life Estimation ICH/FDA guidance allows pooling batch data through statistical testing to determine a best regression model to adequately describe the registration batch data test for common intercept and/or common slope batch poolability if batches can be pooled.
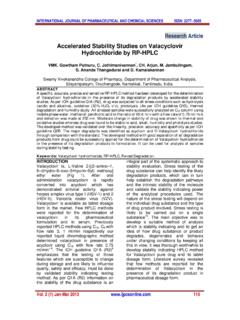
7 shelf life is estimated from the fitted model for the overall batch mean between batch variation is small if batches cannot be pooled, shelf life is estimated on results of the worst batch between batch variation is largeApril 20 21, 2015 Applied Research Consultants, LLC11 ICH/FDA shelf life Estimation Pooled BatchesStorage TimeStability Limiting ResponseConfidence Bandon Pooled Batch MeanAcceptance CriteriaPooled BatchMeanResponseICH ProductShelf LifeICH LabeledShelf LifeApril 20 21, 2015 Applied Research Consultants, LLC12 ICH/FDA shelf life Estimation No Pooling AllowedBatchMeanResponseStorage TimeStability Limiting ResponseConfidence Bandon Worst BatchAcceptance CriteriaICH LabeledShelf LifeICH ProductShelf LifeApril 20 21, 2015 Applied Research Consultants, LLC13 Worst BatchInvestigation of ICH/FDA Statistical Methods Working Group obtained a real life industry data set, contributed by one of our PQRI members 26 stability batches all on same product manufactured batches under statistical control most kept on study for 24 months product was assayed for the active ingredient taken together as a population , the estimated shelf life is months will be the baseline reference representing the product shelf life for the remainder of this presentationApril 20 21, 2015 Applied Research Consultants, LLC14 PQRI Example Industry Data SetStability Limiting Response ( Assay)859095100105110115 Storage Ti me (Months)0612182430364248 Industry Example.
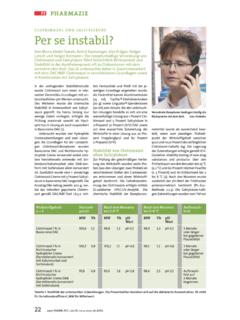
8 26 stability BatchesConsi dered as Total Popul ati on to Defi ne Product Shel f Li fe of 20 21, 2015 Applied Research Consultants, LLC15 Investigation of ICH/FDA Statistical Methods used industry data set to study the empirical distributional properties of the estimated shelf life following ICH methodology using 3 batch and 6 batch randomly sampled stability studies . shelf life was estimated for each study and recorded using 3 batches, there are 2,600 combinations using 6 batches, there are 230,230 combinations which would take days to run with my old computer I didn t do that .. sorry! randomly choose 20,000 sets of 6 batches the run was finished when I woke upApril 20 21, 2015 Applied Research Consultants, LLC16 Fixed Batch Analysis 3 Batch shelf life DistributionCompari son of ICH Shel f Li fe Esti mati on Methodol ogy Usi ng Industry DataUsi ng 3 Batches wi th 24 Months of Data, Extrapol ati ng to 48 Months of Storage Ti meConsi deri ng Al l Possi bl e Response Model sProduct Shel f Li fe = Estimated shelf life (Total = 2600) 20 21, 2015 Applied Research Consultants, LLC17 Fixed Batch Analysis 6 Batch shelf life DistributionCompari son of ICH Shel f Li fe Esti mati on Methodol ogy Usi ng Industry DataUsi ng 6 Batches wi th 24 Months of Data, Extrapol ati ng to 48 Months of Storage Ti meConsi deri ng Al l Possi bl e Response Model sProduct Shel f Li fe = Esti mated Shel f Li fe (Total = 230230)
9 20 21, 2015 Applied Research Consultants, LLC18 Investigation of ICH/FDA Statistical Methods comparing the two empirical distributions with an increase in the number of batches included in the analysis, there is a shifting of the distribution toward shorter estimated shelf lives counterintuitive increase in the amount of information about the product should reflect a better (longer) estimate of shelf life with an increase in the number of registration batches, the probability of getting the extreme (low) batch is increased, shifting the shelf life distribution down disincentive for industry to include more registration batches in their stability studiesApril 20 21, 2015 Applied Research Consultants, LLC19 Investigation of ICH/FDA Statistical Methods ICH/FDA allows three (four) possible models associated with the simple linear model in the pooling process1) unequal intercepts, unequal slopes among batches2) common intercept, unequal slopes among batches3) unequal intercepts, common slope among batches4) common intercept, common slope Model #2 is not specifically allowed under the ICH/FDA slopes first methodology however, is an important model for researchers not clear how slopes first philosophy can be applied to nonlinear or quadratic modelsApril 20 21, 2015 Applied Research Consultants, LLC20 Results of Pooling Process for Fixed Batch Analysis3 Batch Analysis Results (2,600 Total)Reduced ModelNPercentMeanShelf LifeSDOverall146618% 20 21, 2015 Applied Research Consultants, LLC21unequal slopescommon slopeResults of Pooling Process for Fixed Batch Analysis6 Batch Analysis Results (20,000 out of 230,230 Total)
10 Reduced ModelNPercentMeanShelf LifeSDOverall1503525% 20 21, 2015 Applied Research Consultants, LLC22unequal slopescommon slopeICH/FDA Guidance ICH Q1E states The purpose of a stability study is to establish, based on testing a minimum of three batches of the drug substance or product, a retest period or shelf life and label storage instructions applicable to all future batches manufactured and packaged under similar circumstances. ICH/FDA fixed batch statistical analysis restricts the extent of inference to only the registration batches regardless of the number of registration batches included in the stability study fixed batch analysis does not adequately measure the between batch variationApril 20 21, 2015 Applied Research Consultants, LLC23 Random Batch Mixed Model Analysis random batch analysis extends shelf life inference to future batches assumes each batch is a result of a production process which is affected by random manufacturing variation under statistical control between batch variation mixed model analysis avoids pooling process defines best fitted model by modeling the variation structure in the stability data estimates between batch and within batch variationApril 20 21, 2015 Applied Research Consultants.