Transcription of Spectrum and spectral density estimation by the Discrete ...
1 Spectrumandspectraldensity estimationby theDiscreteFouriertransform(DFT),includi nga comprehensive listof windowfunctionsandsomenew Heinzel , A. R udigerand R. Schilling,Max-Planck-Institutf ur Gravitationsphysik(Albert-Einstein-Insti tut)TeilinstitutHannoverFebruary15, 2002 AbstractThisreporttriesto give a practicaloverviewabouttheestimationof power spectra/powerspectraldensitiesusingtheDF T/FFT. Onepoint thatis emphasizedis therelationshipbe-tweenestimatesof power spectraandpower spectraldensitieswhich is given by thee ectivenoisebandwidth(ENBW). Includedis a detailedlistof commonandusefulwindow func-tions,amongthemtheoftenneglected area procedureto testnewprograms,a tableof comprehensive graphsforeach window andtheintroductionof a wholefamilyofnew at-topwindowsthatfeaturesidelobe suppressionlevelsof upto 248dB,as comparedwith 90 dBof thebest at-topwindowsavailableuntil Abbreviationsandsymbols42 Preface53 Introduction54 Scalingbitsto Volts75 DiscreteFourierTransformation(DFT)76 ,peak-peakandrms.
2 107 Samplingtime, Window as anexample.. functionin thefrequencydomain..149 Scalingtheresults1510 Averagingandoverlap1711 Preprocessingof thedata:DCandtrendremoval2012 Puttingit alltogether2113 Testingthealgorithm2114 MATLAB pwelchfunction23 Appendices25A Maximaldynamicrangeof ..25B Computingtheresponseof a window function27C Listof window .. window ..362D at-topwindows.. attopwindow.. attopwindow.. attopwindow.. 3-term attopwindow .. 4-term attopwindow .. 5-term attopwindow .. instrument makers.. at-topwindow.. at-topwindow .. at-topwindow.. at-topwindow.. at-topwindows..49E Bibliography andAcknowledgements49F Graphsof window functions5031 AbbreviationsandsymbolsThefollowinglistc ontainsthosesymbolsandabbreviationsthata ppearin morethanoneplacein (f)Fouriertransform(`transferfunction')o f a window in thefrequencydomain, cients of cosinetermsin de nitionof window functionemaxmaximalamplitudeerrorin onebin( 0:5 f 0:5)fresfrequencyresolution(widthof onefrequencybin),seeSection7fssamplingfr equency, seeSection7nnumber of bitsof anADCNL engthof theDFT/FFTS1sumof window valuesusedfornormalization,seeEquation(1 9)S2sumof squaredwindow valuesusedfornormalization,seeEquation(2 0)ULSB smallestvoltagestepof anADC,correspondingto one`leastsigni cant bit'wjj-thmember of thewindow functionvectorxjdigitizedtimeseries.
3 Inputto DFTin timedomainymraw outputof DFTin frequencydomainADCA nalog-to-DigitalConverterAFAmplitudeFlat ness,seeSection10 BWBandWidthdBdeciBel,seeSection6DC`Direc tCurrent', constant component of a signalDFTD iscreteFourierTransformENBWE ective NoiseBandWidth,seeEquation(22)FFTFastFou rierTransformFFTWA softwarepackagethatimplements theFFTGPLGnu PublicLicenseLSLinear(amplitude) Spectrum LSBL eastSigni cant BitLSDL inearSpectralDensityMATLAB{ Commercialsoftwarepackage{NENBWN ormalizedEquivalent NoiseBandWidth,seeEquation(21)OCOverlapC orrelation,seeSection10 PFPower Flatness,seeSection10 PSPower SpectrumPSDP ower SpectralDensityPSLLPeakSideLobe Levelrmsroot meansquare,seeSection6 ROVR ecommendedOVerlap,seeSection10 SLDRSideLobe DropRateWOSAW elch'sOverlapped SegmentedAverage42 PrefaceThede nitionandusageof theFouriertransformas it is widelyused, ,in theoreticalphysicsconsiderablydi ersfromthepracticalapplicationof theDiscreteFourierTransform(DFT) thisreportis theestimationof spectraandspectraldensitiesusingtheDFT.} }
4 Whilemany methodsforspectrumestimationarediscussed in thestatisticalliterature,we presenthereonlytheonemethod thathasfoundthewidestapplicationin engineeringandexperimentalphysics:the`ov erlapped segmentedaveragingof modi edperiodograms'.Aperiodogramheremeansthe discreteFouriertransform(DFT) of onesegmentof thetimeseries,whilemodi edrefersto theapplicationof a time-domainwindow functionandaveragingis usedto reducethevarianceof willbe discussedin is attributedto Welch[1] andis alsoknownundervariousacronymssuch asWOSA(for`Welch'soverlappedsegmentedave rage') theory, thepracticalimplementationinvolves a number of clarifysomeof theseproblemsfroma practicalpoint of was writtenfortheneedsof thedataanalysisof thelaser-interferometricgravitationalwav e detectorGEO600,butis expectedto be usefulformany otherapplicationsas onlytreatsthecomputationof a spectrumor spectraldensity, startingfroma digitizedtimeseries,typicallymeasuredin Voltsat theinputof theresultingspectruminto otherunits(such as meters)
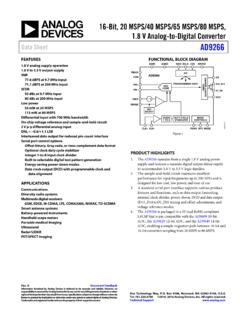
5 Andrelatedproblemssuch as un-doingthee ectof whitening organizedas follows:In Sections3 to 11, individualproblemssuch as scaling,windowing, how to combineallthesedetailsintoa workingalgorithmis givenin Section12. Two somewhatmorespecializedtopicsaretreatedi n AppendicesA andB. TheAppendicesC andD describe in detailmany commonandusefulwindow functions,includingseveralnewhigh-perfor mancefunctionsrecentlydevelopedby oneof theauthors( ).Anoverviewof allwindow functionsin tabularformis given nalpartof thisreport,AppendixF startingonpage50, consistsof graphsshowingthemostimportant characteristicsof each window ,we considera signalx(t) thatcontainsa sinusoidat 1234 Hzwithanamplitudeof 2 Vrms. Furthermoreit containswhitenoisewitha density of 10 mVrms=pHz, band-limitedto therangebetween50 thatsignalis sketchedin Figure1,withtheunitof they-axisintentionallynotyet well de a signalis caneasilybe producedby electroniccircuitsandit is notuntypicalforthesignalsthatwe might expectin thedataanalysisof laser-interferometricgrav-itationalwave detectorssuch asGEO600, furtherassumethatthissignalis sampledby anA/D-converterwitha constant samplingfrequencyfsof, ,10 thus have a time-seriesof equidistant samplesfromtheA/D-converteras inputto a graphresemblingFigure1 which allowsustodetermineboththeamplitudeof thepeak(2 Vrms) andthelevel of thenoise oor (10mVrms=pHz).
6 Ascanalreadybe seenfromthedi erent units( )we willneeddi erent scalingsof they-axisfor51234502000f [Hz]10 mV2 Vrms/sqrt(Hz)rmsSpectrum of yFigure1 Sketch of theexamplespectrumto be discussedin Theunitof they-axisis intentionallynotyet well de willturnoutthattheratiobetweenthetwo di erent scalingfactors(thesquareroot of thee ective noisebandwidth)dependsoninternalsof thealgorithmthatis usedandmustthus be transparent in the facttwographs,onescaledin V andanotheronein V=pHz. We willcalltheformeronea (linear)spectrumandthelattera (linear) spectraldensity describes how thepower of a timeseriesis , it is de nedas theFouriertransformof theautocorrelationsequenceof is simplythesquareroot of thepowerspectraldensity, , which hasa unitsuch as V/pHz, is usuallyindicatedby placinga tilde(e) over thesymbol forthequantity inquestion, correspondingto a voltageUsomething(t) is representedby thesymboleUsomething(f).
7 Onepracticallyimportant relationfora linearspectraldensityeU(f) is itsrelationto therms uctuationof thequantityU, assumedto be band-limitedto thefrequencyrangef1 f f2:Urms=vuuutf2Zf1heU(f)i2df ;(1)Table1 summarizesthe4 di erent ways to expresstheresultof theDFT, assumingtheinputtimeseriesis measuredin ,thedi of thisreport,butarediscussedinmany books(seealsoReference[Schutz]).However, we don'tneedtheseconceptsfortherestof thisreport,wherewe directlyrelatedtotheparametersof theexperiment. For example,if a signalgeneratorthatproducesa sinewave withanamplitudeof 2 Vrmsat 1234 Hzis connectedto theA/Dconverter,we expectin theresultinglinearspectruma peakat theright frequency, theheight of which directlycorrespondsto theamplitudethatwe alonealreadyestablishestheonlycorrectsca lingforlinearspectrafromanexperimentalis t'spoint of spectrumanda spectraldensity is givenby thee ective noisebandwidthandcaneasilybe determinedat thetimewhentheDFTis , spectraldensityV2/HzPSpower spectrumPS=PSD ENBWV2 LSDlinearspectraldensityamplitudespectra ldensityLSD=pPSDV/pHzLSlinearspectrumamp litudespectrumLS=pPS=LSD theequivalent noiseband-width,de nedin Equation(22)
8 Cannotnormallybe reproducedfromeitherof thetwo VoltsSincethedatathatwe want to analyzearemeasuredin Voltsat theinputof theA/D-converter(ADC) andhave alreadybeenconvertedinto binarybitswhenwe getthem,the rstscalingfactorthatusuallymustbe appliedto theraw datais theconversionfrombitsback to usuallystraightforward:if thedataarrive as binarysignedintegers,theyareconvertedto oating-point numbersby multiplicationwiththefactorULSB=Umax Umin2n;(2)whereULSBis thevoltagecorrespondingto a leastsigni cant bitandnthenumber of setof any preampli ersuseddirectlybeforetheA/D-convertercan alsobe appliedat theinputvoltagerange,butrathertwo commonpoints of thehighestandlowestvoltagebin, ,or theirmaximaor unimportant (DFT)ThediscreteFouriertransformin generaltakes a vectorofNcomplexnumbersxk,k= 0: : : N 1,andtransformsit into a vectorofNcomplexnumbersym,m= 0: : : N erent commonde nitionsfortheDFT, di eringonlyin theirnormalization7factors:y(1)m=N 1Xk=0xkexp 2 imkN ;m= 0: : : N 1;(3)y(2)m=1pNy(1)m;(4)y(3)m=1Ny(1)m:(5) Thistransformationis calledthe`forward'DFT, withitsinverse,the`backward'DFT, di eringin thesignof theexponent (+2 imkNinsteadof 2 imkN).
9 Thepracticalimplementationof theDFTona computernearlyalwaysusestheFastFourierTr ansform(FFT) algorithm,andthetermsDFTandFFTareusedint erchangeablyin ( [FFTW]), computey(1).TheFourierfunctionofMathemat icacomputesy(2), which incidentallyis theonly`symmet-rical'way to de neforwardandbackwardDFTsuch thesimplestcomputationof thespectrum,however,we needy(3). Thatcanbe directlyseenif we we increaseN,y(1)willpick upmoreandmoreof thesignalandtheresultin theadequatefrequencybinwillincreasepropo rtionallytoN, whileourdesiredresult,theamplitude,obvio uslymustnotdependonN. If,as is usual,window functionsarebeingused,thewindow-relatedn ormalizationwilltake careof thisfactor(seeSection9). Nevertheless,whenanFFTalgorithmis usedforthe rsttime,careshouldbetakento determinewhich of (3), (4) or (5) it thegeneralde nitionof theDFT, thetimeseriesof thedigitizedinputsignalis always consequence,theoutputarrayymobeysthefoll owingrelationship:yN m=y m;(6)where particular,ifNis even,y0andyN= onwe willassumethatNis halfof thearray,yN=2+1: : : yN 1is thusredundant andnever computedby e `packed' thecaseof theFFTW package(seeReference[FFTW]), theresultisa realvectorzi,i= 0: : : N 1 withzi=<fyig;0 i N=2;(7)zN i==fyig;0< i < N=2:(8)If onlya complex-to-complexFFTsubroutineis available, Reference[Press]describes two ways of usingit to computereal-to-complextransformswithmode ratee theabove relationshipit is convenient to haveNeven,as we a power of 2.
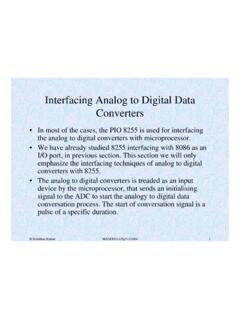
10 Thatis, however,anunnecessarilystringent limitationin many ,forexample,willcomputetheDFTforany positive integerN, andwithhighe ciencyforintegersof theformN= 2a3b5c7d11e13f;(9)wheree+fis either0 or 1 andtheotherexponents arearbitrary. Thisgives more exibilityin thechoiceof thefrequencyresolutionfres, seeSections7 ,it canalsobe con guredto e cientlycomputetheFFTforotherintegers,if ,peak-peakandrmsThenextsimplescalingfact orconcernstheunitsof theamplitude(Voltsin thisexample). erent unitsarein commonusage(seeFigure2):UtVpkVpk pkVrmsFigure2 Threeways to `Voltspeak'is themostobviousmeasurement of anamplitude,it is theheight of thepeakmeasuredfromtheaveragevalue( thereis noDCcomponent).Vpk pk`Voltspeak-to-peak'.Thismeasurement is exactlytwo timesbiggerthan`Voltspeak'andpopularwith experimentalistsbecauseit caneasilybe readdirectlyfromanoscillo-scope (regardlessof any DCo sets).