Example: dental hygienist
The Multivariate Gaussian Distribution
1 Relationship to univariate Gaussians Recall that the density function of a univariate normal (or Gaussian) distribution is given by p(x;µ,σ2) = 1 √ 2πσ exp − 1 2σ2 (x−µ)2 . Here, the argument of the exponential function, − 1 2σ2(x−µ) 2, is a quadratic function of the variable x.
Tags:
Information
Domain:
Source:
Link to this page:
Documents from same domain
Data Fusion for Predicting Breast Cancer Survival
cs229.stanford.eduData Fusion for Predicting Breast Cancer Survival Linbailu Jiang, Yufei Zhang, Siyi Peng Mentor: Irene Kaplow December 11, 2015 1 Introduction 1.1 Background
Part IV Generative Learning algorithms
cs229.stanford.eduCS229Lecturenotes Andrew Ng Part IV Generative Learning algorithms So far, we’ve mainly been talking about learning algorithms that model p(y|x;θ), the conditional distribution of y …
Automated Bitcoin Trading via Machine Learning …
cs229.stanford.eduAutomated Bitcoin Trading via Machine Learning Algorithms Isaac Madan Department of Computer Science Stanford University Stanford, CA 94305 imadan@stanford.edu
Prediction of consumer credit risk - Machine learning
cs229.stanford.eduCS229 Prediction of consumer credit risk Marie-Laure Charpignon mcharpig@stanford.edu Enguerrand Horel ehorel@stanford.edu Flora Tixier ftixier@stanford.edu
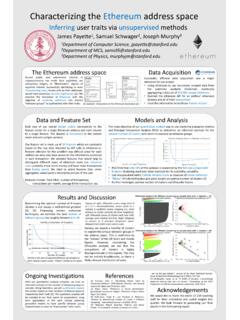
Inferring user traits via unsupervised methods
cs229.stanford.edufeature vector for a single Ethereum address and each column to a single feature. The dataset is normalized to the sample ... "Ethereum: A secure decentralised generalised transaction ledger." Ethereum Project Yellow Paper 151 (2014). [3] Kodinariya, Trupti M., and Prashant R. Makwana. "Review on determining number of Cluster in K-Means
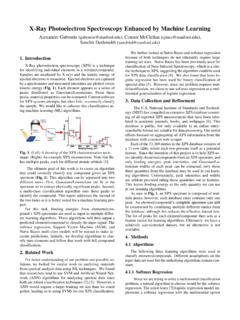
X-Ray Photoelectron Spectroscopy Enhanced by …
cs229.stanford.eduX-Ray photoelectron spectroscopy (XPS) is a technique for identifying individual elements in a mixture/compound. Samples are irradiated by X …
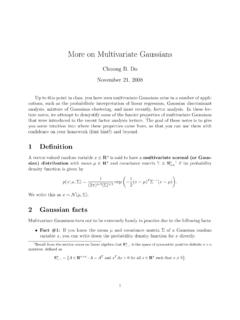
More on Multivariate Gaussians - CS229: Machine …
cs229.stanford.eduMore on Multivariate Gaussians Chuong B. Do November 21, 2008 Up to this point in class, you have seen multivariate Gaussians arise in a number of appli-
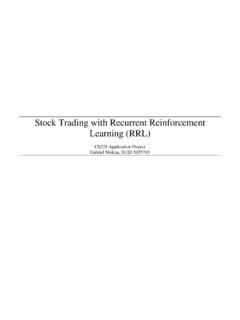
Stock Trading with Recurrent Reinforcement …
cs229.stanford.eduStock Trading with Recurrent Reinforcement Learning (RRL) CS229 Application Project Gabriel Molina, SUID 5055783
James Payette,1 Samuel Schwager, and Joseph …
cs229.stanford.eduJames Payette,1 Samuel Schwager,2 and Joseph Murphy3 1Department of Computer Science, Stanford University, Stanford, CA 94305, USA 2Department of Mathematical and Computational Science, Stanford University 3Department of …

Sales Prediction with Time Series Modeling - …
cs229.stanford.eduSales Prediction with Time Series Modeling Gautam Shine, Sanjib Basak I. Introduction Predicting sales-related time series quantities like number of transactions, page views, and revenues is ... P.A. Fishwick, Time series forecasting using neural networks vs Box-Jenkins methodology, Simulation, Vol. 57 (1991) pp. 303-310.
Related documents

Multivariate Analysis of Variance (MANOVA): I. Theory
ibgwww.colorado.eduthe univariate ANOVA. For example, the variance in BDI due to psychotherapy calculated from a univariate ANOVA of the BDI would be the first diagonal element in the V p matrix. The variance of HRS calculated from a univariate ANOVA is the second diagonal element in V p. The variance in CSR due to the interaction between

Summary: Differences between univariate and bivariate data.
www.math.kent.eduUnivariate Data Bivariate Data involving a single variable involving two variables does not deal with causes or relationships deals with causes or relationships the major purpose of univariate analysis is to describe the major purpose of bivariate analysis is ...

Logistic Regression: Univariate and Multivariate
www.cantab.netinterpretation in univariate regression. I We dealt with 0 previously. I In general the coefficient k (corresponding to the variable X k) can be interpreted as follows: k is the additive change in the log-odds in favour of Y = 1 when X k increases by 1 unit, while the …

A Review and Comparison of Methods for Detecting Outliers ...
d-scholarship.pitt.eduin Univariate Data Sets University of Pittsburgh 2006 Submitted to the Graduate Faculty of Graduate School of Public Health in partial fulfillment of the requirements for the degree of Master of Science by Songwon Seo BS, Kyunghee University, 2002
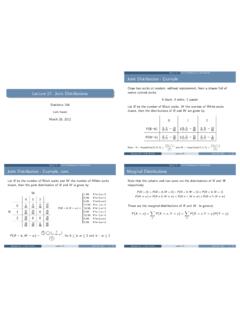
Joint Distribution - Example - Duke University
www2.stat.duke.eduUnivariate de nition: P(X 2A) = Z A f (x) dx E[g(X)] = Z 1 1 g(x) f (x) dx Bivariate de nition: P(X 2A;Y 2B) = Z A Z B f (x;y) dx dy E[g(X;Y)] = Z 1 1 Z 1 1 g(x;y) f (x;y) dx dy Statistics 104 (Colin Rundel) Lecture 17 March 26, 2012 10 / 32 Section 5.1 Joint Distributions of Continuous RVs Example 1 - Joint Uniforms

Median and Interquartile Range -- Nonparametric …
psych.unl.eduMedian and Interquartile Range -- Nonparametric Univariate Statistics for Quantitative Variables Application: To obtain a summary of the distribution of scores (center and spread) for a variable when the data are not normally distributed, are not measured on an interval scale, and/or there is only a small sample. Thus, they are used in the same data

Univariate Distribution Relationships - William & Mary
www.math.wm.eduUnivariate Distribution Relationships Lawrence M. LEEMIS and Jacquelyn T. MCQUESTON Probability distributions are traditionally treated separately in introductory mathematical statistics textbooks. A figure is pre-sented here that shows properties that individual distributions possess and many of the relationships between these distribu-tions.
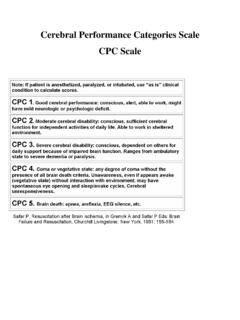
Cerebral Performance Categories Scale CPC Scale
www.azdhs.govNote: If patient is anesthetized, paralyzed, or intubated, use "as is" clinical condition to calculate scores. CPC l. Good cerebral performance: conscious, alert, able to work, might