Transcription of Using Bloomberg to get the Data you need
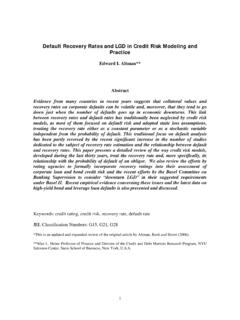
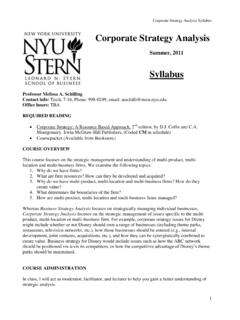
1 1 Using Bloomberg to get the data you need2 Contents of Package1. Getting information on your companyPages 3-302. Getting information on comparable companiesPages 31-343. Getting macro economic informationPages 35-443 Using Bloomberg to get information on your companyEquityEquity1. Finding Securities1. Finding Securities1. Ticker Symbol Look Up1. Ticker Symbol Look UpEnter the name of your companyChoose the listing for your companythat you are interested in2. Company Information2. Company Information/Description/Description1. Description (DES)1. Description (DES)Fundamentals and Fundamentals and Earnings AnalysisEarnings AnalysisHistorical Historical PricesPricesRisk andRisk andVolatilitiyVolatilitiy1.
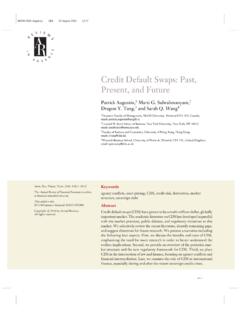
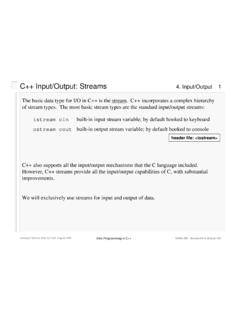
2 Financial 1. Financial Analysis (FA)Analysis (FA)Corp BondCorp Bond25. Print 25. Print Complete Complete reportreport13. Earnings 13. Earnings Estimates (EE)Estimates (EE)3) Zacks3) ZacksPx Table w/ AvgPx Table w/ AvgVol (HP)Vol (HP)Beta Beta CalculationCalculation(BETA)(BETA)Change defaults:Period to MStarting point: 5 years agoLeave ending point as is1. Finding Securities1. Finding SecuritiesTicker Symbol Look UpTicker Symbol Look UpEnter the name of your companyChoose the listing for your companythat you are interested inPick a long term bond for the companyDescriptionDescriptionShadowShado w: Indicates menu choices on BloombergRegular font.
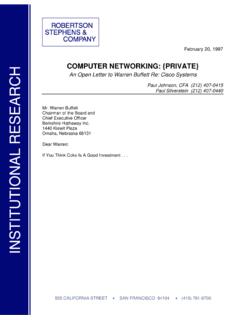
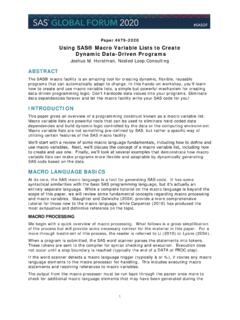
3 Indicates input that you have to provide or change To get ratings informationTo get all other informationIssue/Issuer InformationIssue/Issuer InformationHistoricalHistoricalVolatilit yVolatility(HVT)(HVT)4 WHERE TO FIND THE DATAThis is a listing of all of the financial data that you will need to analyze your company and where exactly on the Bloomberg output you will find the you have identified what you would like to look up, use the item number and go to the specified page number on Bloomberg to look it BloombergPage NumberUsed in this spreadsheet1 BetaEquity: Beta Calculation29 Capstr, Dividend, Valuation2 Current EPSE quity: Description8 Valuation3 Payout RatioEquity: Description10 Valuation4 Total DebtEquity: Description16 Capstr, Dividend, Valuation5 Book Value of EquityEquity: Description16 CapStr, Valuation6 Number of Shares OutstandingEquity: Description8 CapStr, Valuation7 Tax Rate Equity: Description10 CapStr, Valuation8 Non-Cash Working CapitalEquity: Description16 Valuation9 Capital ExpendituresEquity: Description17 CapStr, Valuation10 DepreciationEquity.
4 Description17 CapStr, Valuation11 EPS - 5 years agoFinancial Analysis12 Valuation12 Analyst Projection for GrowthEquity: Earnings Estimates26 Valuation13 Interest ExpensesEquity: Description15 CapStr, Valuation14 Net Sales/ RevenuesEquity: Description15 Valuation15 Current PriceEquity: Description8 Risk, CapStr, Valuation516 EBIT/Operating IncomeEquity: Description15 CapStr17 Bond RatingCorp Bond: Description 30 CapStr18 Past 10 years Net IncomeEquity: Financial Analysis25 Dividends19 Past 10 years DepreciationEquity: Financial Analysis25 Dividends20 Past 10 years Chg in non-cash Work.
5 : Financial Analysis25 Dividends21 Past 10 years DividendsEquity: Financial Analysis25 Dividends22 Past 10 years Equity BuybacksEquity Financial Analysis25 Dividends23 Past 10 years Cap ExEquity: Financial Analysis25 Dividends24 Average Debt Ratio 10 yearsEquity Financial Analysis21 Dividends25 Past 10 years BV of EquityEquity Financial Analysis24 Dividends26 Return on StockEquity: Financial Analysis18 Dividends27 Operating Income past 10 yearsEquity: Financial Analysis22 DebtDesign28 Stock Price: Last 60 monthsEquity: Px Table27 Risk29 Value of Firm: Last 10 yearsEquity:: Financial Analysis21 Dividends30 EBITDA for last 10 yearsEquity: Financial Analysis2131 Alpha (Intercept)Beta Calculation2932R squaredBeta Calculation2933 Standard Error of BetaBeta Calculation296 Instructions for Getting Bloomberg data Pick Equity Choose 1.
6 Finding Securities Choose Ticker Symbol Look up Enter the name of your company. You will get all of the equity listings that the company has. Choose the one that you are interested in. Forinstance, if you look up Nestle, you will get Nestle s local listings in Switzerland (Registered and Bearer Stock) as well as all of Nestle sADR listings around the world. You might have to work through the listings by trial and error until you get the listing that has all of thefinancial information that you want. Once you are in equity screen for your company, Type HDS: Print page 1 off Choose Description (DES): Print all 10 pages off; Ignore beta on first page.
7 Choose Financial Analysis (FA): Choose Print Full Report Choose Earnings Estimates (EE) Choose Zacks Print off first page If you do not have a beta, pick Beta Calculations (BETA) Using the tab button, you can change the period to M Using the tab button, you can change the range to a 5-year range Using the tab button, you can also change the market index. Go back to the main menu (out of equity). Pick Corp Bond. Enter the name of your company7 You will get a list of corporate bonds issued by your company, if any. Choose a long term bond (preferable without special features like convertibility) from the list.
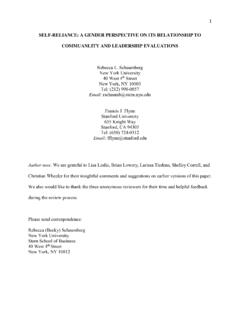
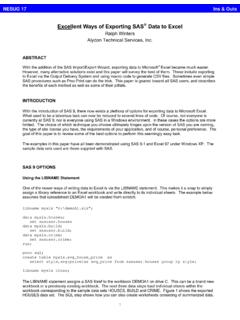
8 Choose DescriptionB15B15 Current PriceB6 Shares outstandingB2 Trailing 12-month EPS89B7 Marginal tax rateUse 36% if < 36%Use 50% if > 50%B3 Payout Ratio1011 Quarterly EPS for last 5 years121314 Use most recent financial year for which data is available: B14 RevenuesB16 Operating IncomeB13 Interest Expenses15B8 Non-cash Working Capital= (Inventories+Acc Rec) - (Acc Payable + Other ST Liabilities)=(8173+6763)-(3185+6808) = 4943As % of Revenue = 4943/42895 = = ST Borrowings + LT Borrowings = 1226+3158 = 4384B5 Book Value of Equity16B10 Deprec & AmortB9 Capital Expenditure17B26 Past Stock Returns=% Change + Dividend Yield181920B29 Firm Value = Market Capitalization + ST Debt +LT DebtB30 Market Value- Last 10 yearsB24 Average Market D/E Ratio21B27 Operating Income: Last 10 years2223 Book Value of Equity.
9 Last 10 years24B18 Net Income: Last 10 yearsB20 Change in WC (A negative sign indicates an increase in WC)B19 Deprec & Amort: Last 10 yearsB21 Dividends Paid: Last 10 yearsB22 Net Stock Buybacks: Dec Capital Stock - Inc Capital StockB23 Capital Expenditures: Last 10 years25B12 Analyst Estimate of expected growth26B28 Month-end Stock Prices2728B1 Regression BetaB32 Regression InterceptB33R-squaredB34 Std Error of Beta29B17 Bond Rating3031 data ON COMPARABLE COMPANIESI. Getting data on related companies Pick Equity Choose 1. Finding Securities Choose Ticker Symbol Look up Enter the name of your company Once you are in equity screen for your company, enter Fundamentals and Earnings Analysis Choose Relative Value (RV): You can modify the data that is printed Using Bloomberg to get Sector data or to Screen Stocks Start with this screen by typing ESRCH 33 Pick the industry group you want to analyze or collect data from Pick the market that you want to analyze34 Pick the data you want in your datasetWarning: This is not the friendliest interface in the world.
10 You will often find yourself building elaborate criteria for 20 minutes and then losingthem all because you hit the menu button twice instead of once. I would suggest saving the criteria under Save Set as you go along and assigningthe criteria set a name. I would also suggest adding the company name to your data set - the default is only the ticker symbols, which are tough toexpand, and keeping your data sets manageable with 3-4 Historical Macroeconomic Information IndexIndexEconomic StatisticsEconomic StatisticsGovtsGovtsCPI/PPICPI/PPICPICPI 15. CPI - All Items15. CPI - All Items2.