Transcription of Simulating Data with SAS
1 Simulating data with SAS Rick WicklinContents Acknowledgments v I Essentials of Simulating data 1 Chapter 1. Introduction to Simulation .. 3 Chapter 2. Simulating data from Common Univariate Distributions .. 11 Chapter 3. Preliminary and Background Information .. 29 II Basic Simulation Techniques 49 Chapter 4. Simulating data to Estimate Sampling Distributions .. 51 Chapter 5 . Using Simulation to Evaluate Statistical Techniques .. 73 Chapter 6. Strategies for Efficient and Effective Simulation .. 93 III Advanced Simulation Techniques 107 Chapter 7 . Advanced Simulation of Univariate data .. 109 Chapter 8. Simulating data from Basic Multivariate Distributions .. 129 Chapter 9. Advanced Simulation of Multivariate data .. 153 Chapter 10. Building Correlation and Covariance Matrices .. 175 IV Applications of Simulation in Statistical Modeling 195 Chapter 11.
2 Simulating data for Basic Regression Models .. 197 Chapter 12. Simulating data for Advanced Regression Models .. 225 Chapter 13. Simulating data from Times Series Models .. 251 Chapter 14. Simulating data from Spatial Models .. 263 Chapter 15. Resampling and Bootstrap Methods .. 281 Chapter 16. Moment Matching and the Moment-Ratio Diagram .. 297 V Appendix 323 Appendix A. A SAS/IML Primer .. 325 Index 339 From Simulating data with SAS . Full book available for purchase Simulating data with SAS by Rick Wicklin. Copyright 2013, SAS Institute Inc., Cary, North Carolina, USA. ALL RIGHTS 2 Simulating data from CommonUnivariate to Simulating Univariate data .. Started: Simulate data from the Standard Normal Distribution .. for Simulating Univariate data in the data Step .. data from Discrete Distributions.
3 Bernoulli Distribution .. Binomial Distribution .. Geometric Distribution .. Discrete Uniform Distribution .. Distributions .. Poisson Distribution .. data from Continuous Distributions .. Normal Distribution .. Uniform Distribution .. Exponential Distribution .. Univariate data in SAS/IML Software .. Discrete data .. from Finite Sets .. Continuous data .. Distributions Supported in SAS Software .. Introduction to Simulating Univariate DataThere are three primary ways to simulate data in SAS software: Use the data step to simulate data from univariate and uncorrelated multivariate can use the RAND function to generate random values from more than 20 standardunivariate distributions. You can combine these elementary distributions to build morecomplicated Simulating data with SAS . Full book available for purchase Chapter 2: Simulating data from Common Univariate Distributions Use the SAS/IML language to simulate data from many distributions, including correlatedmultivariate distributions.
4 You can use the RANDGEN subroutine to generate random valuesfrom standard univariate distributions, or you can use several predefined modules to generatedata from multivariate distributions. You can extend the SAS/IML language by defining newfunctions that sample from distributions that are not built into SAS. Use specialized procedures in SAS/STAT software and SAS/ETS software to simulate datawith special properties. Procedures that generate random samples include the SIMNORMAL,SIM2D, and COPULA chapter describes the two most important techniques that are used to simulate data in SASsoftware: the data step and the SAS/IML language. Although the data step is a useful tool forsimulating univariate data , SAS/IML software is more powerful for Simulating multivariate data . Tolearn how to use the SAS/IML language effectively, see Wicklin (2010).Most of the terminology in this book is standard.
5 However, a term that you might not be familiarwith is the termrandom variate. A random variate is a particular outcome of a random variable(Devroye 1986). For example, letXbe a Bernoulli random variable that takes on the value 1with probabilitypand the value 0 with probability1 p. If you draw five observations from theprobability distribution, you might obtain the values0;1;1;0;1. Those five numbers are randomvariates. This book also uses the terms simulated values and simulated data . Some authors referto simulated data as fake data . Getting Started: Simulate data from the StandardNormal DistributionTo simulate data means to generate a random sample from a distribution with known an example is often an effective way to convey main ideas, the following data stepgenerates a random sample of 100 observations from the standard normal distribution.
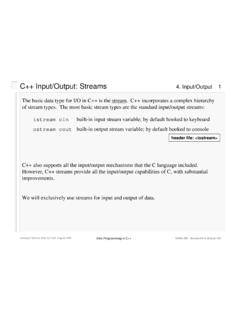
6 Figure the first five Normal(keep=x);call streaminit(4321); /*Step 1*/do i = 1 to 100;/*Step 2*/x = rand("Normal");/*Step 3*/output;end;run;proc print data =Normal(obs=5);run; : Template for Simulating Univariate data in the data Step 13 Figure Few Observations from a Normal data step consists of three the seed value with the STREAMINIT function. Seeds for random number generation arediscussed further in Section Use a DO loop to iterate 100 each iteration, call the RAND function to generate a random value from the standardnormal you change the seed value, you will get a different random sample. If you change the number100, you will get a sample with a different number of observations. To get a nonnormal distribution,change the name of the distribution from Normal to one of the families listed in Section Somedistributions, including the normal distribution, include parameters that you can specify after Template for Simulating Univariate data in the DATAStepIt is easy to generalize the example in the previous section.
7 The following SAS pseudocode shows abasic template that you can use to generateNobservations with a specified distribution:%let N = 100;/*size of sample*/ data Sample(keep=x);call streaminit(4321); /*or use a different seed*/do i = 1 to &N;/*&N is the value of the N macro var*//*specify distribution and parameters*/x = rand("DistribName", param1, param2, ..);output;end;run;The simulated data are written to theSampledata set. The macro variableNis defined in orderto emphasize the role of that parameter. The expression&Nis replaced by the value of the macroparameter (here, 100) before the data step is Chapter 2: Simulating data from Common Univariate DistributionsThe (pseudo) data step demonstrates the following steps for Simulating call to the STREAMINIT subroutine, which specifies the seed that initializes the randomnumber stream. When the argument is a positive integer, as in this example, the randomsequence is reproducible.
8 If you specify 0 as the argument, the random number sequence isinitialized from your computer s internal system clock. This implies that the random sequencewill be different each time that you run the program. Seeds for random number generation arediscussed in Section A DO loop that call to the RAND function, which generates one random value each time that the functionis called. The first argument is the name of a distribution. The supported distributions areenumerated in Section Subsequent arguments are parameter values for the Simulating data from Discrete DistributionsWhen the set of possible outcomes is finite or countably infinite (like the integers), assigning aprobability to each outcome creates adiscrete probability distribution. Of course, the sum of theprobabilities over all outcomes is following sections generate a sample of sizeND100from some well-known discretedistributions.
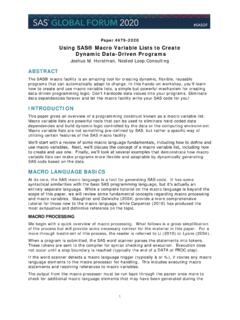
9 The code is followed by a frequency plot of the sample, which is overlaid with theexact probabilities of obtaining each value. You can use PROC FREQ to compute the empiricaldistribution of the data ; the exact probabilities are obtained from the probability mass function(PMF) of the distribution. Section describes how to overlay a bar chart with a scatter plot thatshows the theoretical The Bernoulli DistributionThe Bernoulli distribution is a discrete probability distribution on the values 0 and 1. The probabilitythat a Bernoulli random variable will be 1 is given by a parameter,p,0 p 1. Often a 1 islabeled a success, whereas a 0, which occurs with probability1 p, is labeled a failure. The following data step generates a random sample from the Bernoulli distribution withpD1= you identifyxD1with heads andxD0with tails, then this data step simulatesND100tosses of a fair N = 100; data Bernoulli(keep=x);call streaminit(4321);p = 1/2;do i = 1 to &N;x = rand("Bernoulli", p);/*coin toss*/output;end;run; : Simulating data from Discrete Distributions 15 You can use the FREQ procedure to count the outcomes in this simulated data .
10 For this sample, thevalue 0 appeared 52 times, and the value 1 appeared 48 times. These frequencies are shown by thebar chart in Figure The expected percentages for each result are shown by the round from Bernoulli Distribution (pD1=2) Overlaid with PMFIfXis a random variable from the Bernoulli distribution, then the expected value ofXispand thevariance p/. In practice, this means that if you generate a large random sample from theBernoulli distribution, you can expect the sample to have a sample mean that is close topand asample variance that is close p/. The Binomial DistributionImagine repeating a Bernoulli trialntimes, where each trial has a probability of success equal large (near 1), you expect most of the Bernoulli trials to be successes and only a few of thetrials to be failures. On the other hand, ifpis near1=2, you expect to get aboutn= binomial distribution models the number of successes in a sequence ofnindependent Bernoullitrials.