Transcription of Women in the Workforce - Census.gov
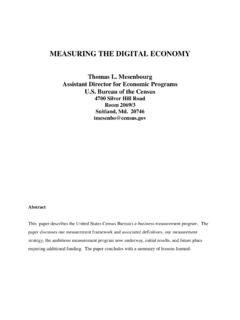
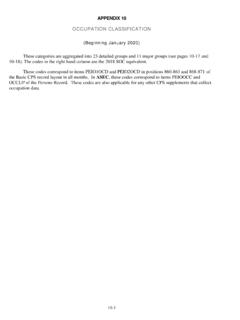
1 Women in the WorkforceSubject DefinitionsEmployedEmployed includes all civilians 16 years old and over who were either (1) at work during the reference week; or (2) those who did not work during the reference week but had jobs or businesses from which they were temporarily absent. Full-time, year-round workers All people 16 years old and over who usually worked 35 hours or more per week for 50 to 52 weeks in the past 12 of Full-Time, Year-Round Workers With Earnings by Sex: 1967 to 2009 Numbers in : People 15 years old and older beginning in 1980 and people 14 years and older as of the following year for previous years. Before 1989, data are for civilian workers : census Bureau, Current Population Survey, 1968 to 2009 Annual Social and Economic $0$10,000$20,000$30,000$40,000$50,000$60 ,000196019671974198119881995200220095 Median Earnings of Full-Time, Year-Round Workers by Sex:1960 to 2009$47,100$36,300 Earnings in 2009 dollarsMenWomen$20,600$34,000 Note: Income rounded to nearest $100.
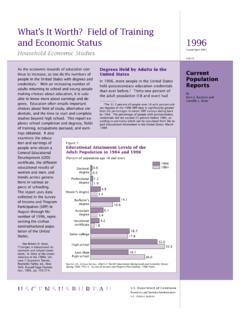
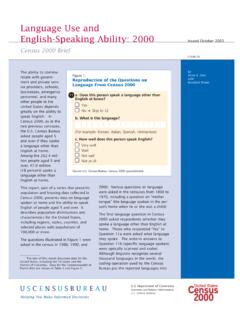
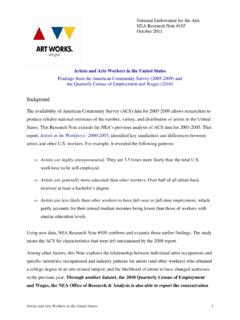
2 People 15 years old and older beginning in 1980 and people 14 years and older as of the following year for previous years. Before 1989, data are for civilian workers : census Bureau, Current Population Survey, 1961 to 2009 Annual Social and Economic of Women s-to-Men s Median Earnings for Full-Time, Year-Round Workers: 1960 to 2009 Note: People 15 years old and older beginning in 1980 and people 14 years and older as of the following year for previous years. Before 1989, data are for civilian workers : census Bureau, Current Population Survey, 1961 to 2009 Annual Social and Economic of Women 's to Men's Median Earnings in Selected Occupations for Full-Time, Year-Round Workers: 2007-2009 Source: census Bureau, American Community Survey, 2007-20093032343638404244464850197519761 9771978197919801981198219831984198519861 9871988198919901991199219931994199519961 9971998199920002001200220032004200520062 007200820092010 RecessionMenWomenUsual Hours Worked bySex: 1975-2010 Work hoursSource.
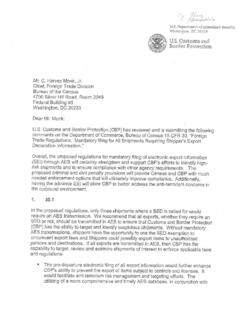
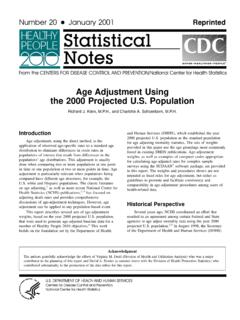
3 census Bureau, Current Population Survey, 1975 to 2010 Annual Social and Economic Supplements 0%5%10%15%20%25%30%35%Management and professionalServiceSales and officeFarming, fishing, and forestryConstruction, extraction, maintenance, and repairProduction, transportation, and material movingMajor Occupation Groups by Percentage of Mothers of Preschoolers Opting Out of the Labor Force: 2009 Note: Occupation data are collected for the current, primary job or most recent job held in the past 5 years if not currently : census Bureau, 2009 American Community Survey0510152025303540194019501960197019 80199020002010 Percent with bachelor's degree or moreWomenMenPercentage of Men and Women with a Bachelor's Degree or More, Ages 25 and Older: 1940 to 2010 Note: Prior to 1992, percent of 4 years of college or moreSource: 1940 census , Current Population Survey various years 1947 to 1962, 1964 to 2002 March Current Population Survey, 2003 to 2010 Annual Social and Economic Supplement to the Current Population Survey 0510152025303540194019501960197019801990 20002010 Percent with bachelor's degree or moreMenWomenPercentage of Men and Women with a Bachelor's Degree or More, Ages 25 to 29: 1940 to 2010 Note: Prior to 1992, percent of 4 years of college or more Source: 1940 census , Current Population Survey various years 1947 to 1962, 1964 to 2002 March Current Population Survey, 2003 to 2010 Annual Social and Economic Supplement to the Current Population Survey 0%5%10%15%20%25%30%35%40%194019501960197 01980199020002009 Percent WomenPercentage of Managers Who Are Women .
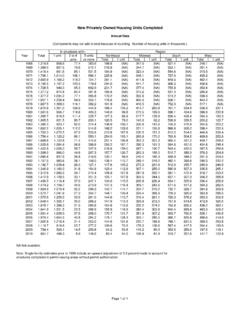
4 1940-2009 census Bureau, decennial census 1940 to 2000, 2009 American Community Source: census Bureau, Survey of Business Owners, 2002 and 2007 and Survey of Women -Owned Business Enterprises, 1997 Percentage of Women -Owned Businesses:1997, 2002, and 2007 of Employees in Women -Owned Firms: 1997, 2002 and 2007 Source: census Bureau, Survey of Business Owners, 2002 and 2007 and Survey of Women -Owned Business Enterprises, 19970%5%10%15%20%25%30%Less than $5,000$5,000 to $9,999$10,000 to $24,999$25,000 to $49,999$50,000 to $99,999$100,000 to $249,999$250,000 to $499,999$500,000 to $999,999$1,000,000 or moreWomen-owned businessesMen-owned businessesPercentage of Firms by Sales/Receipts Levels by Sex of Owner: 2007 Source: census Bureau, Survey of Business Owners 2007 Relatively High and Low Women OwnershipSource: census Bureau, Survey of Business Owners 2007 's, doctorate, or professional degreeBachelor's degreeLess than bachelor's degreeEducational Attainment of Owners of Respondent Firms by Sex: 2007 Source: census Bureau, Survey of Business Owners 2007, than 40 hours40 hoursLess than 40 hoursAverage Hours Worked Per Week by Owners of Respondent Firms by Sex: 2007 Source: census Bureau, Survey of Business Owners 2007 in the