Excellent Ways of Exporting SAS Data to Excel
allow you to save the data as a CSV or TXT file and performs simple filtering and sorting of data. This software will also support some cross-platform SAS data sets, so it is a great tool for multiple OS environments. The following example use the sample data set SASUSER.CLASS. • Start the SAS System Viewer.
Download Excellent Ways of Exporting SAS Data to Excel
Information
Domain:
Source:
Link to this page:
Documents from same domain
Define-XML v2 – What's New - Lex Jansen
lexjansen.comPhUSE 2013 2 OPERATIONAL DATA MODEL The Define-XML standard is based on the CDISC Operational Data Model (ODM) XML schema [6]. The new Define-
The Automatic Detection of Problems in the SAS Log
lexjansen.comThe Automatic Detection of Problems in the SAS Log MaryAnne D. Hope, Health Services Advisory Group, Phoenix, Arizona ABSTRACT There are numerous types of errors generated from a SAS® run, some obvious, others not so obvious.The red

Hierarchical Logistic Regression with SAS GLIMMIX
lexjansen.comHierarchical Logistic Regression Modeling with SAS GLIMMIX Jian Dai, Zhongmin Li, David Rocke University of California, Davis, CA ABSTRACT Data often have hierarchical or clustered structures, such as patients clustered within hospitals or students nested
Hyperlinks and Bookmarks with ODS RTF - Lex Jansen
lexjansen.com1 Paper TT21 Hyperlinks and Bookmarks with ODS RTF Scott Osowski, PPD, Inc, Wilmington, NC Thomas Fritchey, PPD, Inc, Wilmington, NC ABSTRACT

Data Transfer from Microsoft Access to SAS Made Easy
lexjansen.comPaper CC12 Data Transfer from Microsoft Access to SAS Made Easy Zaizai Lu, AstraZeneca Pharmaceutical David Shen, ClinForce Inc. ABSTRACT
Illustrative Logistic Regression Examples using PROC ...
lexjansen.comsensitivity). These pairs constitute the Receiver Operating Characteristic (ROC) curve. Points far above the 45 degree line are desirable and one hopes to have this curve rise as quickly as possible from the origin. The 45 degree line in the unit square would correspond to an area under the curve (AUC) of 0.5

A Step-by-Step Guide to Survival Analysis
lexjansen.comINTRODUCTION Survival analysis is the phrase used to describe the analysis of data in the form of times from a well-defined ... There are three important SAS procedures available for analyzing survival data: LIFEREG, LIFETEST and PHREG (BPHREG). PROC LIFEREG is a parametric regression procedure for modeling the distribution of ... Categorical ...
Using and Understanding LSMEANS and LSMESTIMATE
lexjansen.comusing the STORE statement and PROC PLM to test hypotheses without having to redo all the model calculations. This material is appropriate for all levels of SAS experience, but some familiarity with linear models is assumed. INTRODUCTION . In a linear model, some of the predictors may be continuous and some may be discrete. A continuous predictor is
How do I map that? - SDTM Implementation Challenges
lexjansen.comGuide became available in early 2009 and greatly helped the mapping exercise, even though it meant updating a ... approach would uniquely identify the location in combination with the evaluation name (--TEST/--TESTCD). However, this is not a completely appropriate use of the categorization of the category variables as these should be used to ...

Testing Normality of Data using SAS
lexjansen.comThe first step of data analysis usually involves making distributional assumption about the data. If the data is considered truly a sample from some classes of probability distributions, we cannot only summarize the data compactly based the approximate distribution, but also carry out proper statistical procedures to gain valuable inferences.
Related documents
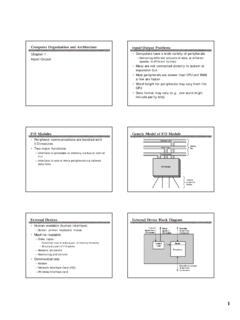
Computer Organization and Architecture Input/Output …
aturing.umcs.maine.eduInput/Output Computer Organization and Architecture Input/Output Problems • Computers have a wide variety of peripherals —Delivering different amounts of data, at different speeds, in different formats • Many are not connected directly to system or expansion bus • Most peripherals are slower than CPU and RAM; a few are faster

Using Bloomberg to get the Data you need
people.stern.nyu.eduWHERE TO FIND THE DATA This is a listing of all of the financial data that you will need to analyze your company and where exactly on the Bloomberg output you will find the data. Once you have identified what you would like to look up, use the item number and go to the specified page number on Bloomberg to look it up.
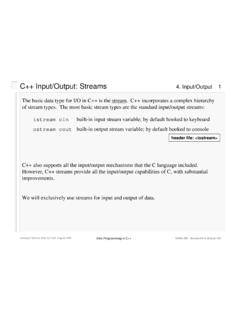
C++ Input/Output: Streams - Virginia Tech
courses.cs.vt.eduThis sets up the file streams to read data from a file called "readme.data" and write output to a file called "writeme.data". Computer Science Dept Va Tech August, 2001

SAS® ODS Destination for Microsoft Excel: Use the STYLE ...
www.sas.comcollection of attributes that affect some output of a SAS program. Second, as a style attribute, which is a name-value pair that describes an output behavior or visual result that you want to apply to output data. A style attribute change is the most specific way to directly change how your data looks.
Simulating Data with SAS
support.sas.com• Use the DATA step to simulate data from univariate and uncorrelated multivariate distributions. You can use the RAND function to generate random values from more than 20 standard univariate distributions. You can combine these elementary distributions to build more complicated distributions. From Simulating Data with SAS ®. Full book available
Instruction Sets: Characteristics and Functions Addressing ...
www.csee.umbc.eduData Transfer Instructions •Are responsible for moving data around inside the processor as well as brining in data or sending data out •Examples: Store, load, exchange, move, set, push, pop •Each Instruction should have: •source and destination (memory, register, input/output port) •amount of data
Using SAS® Macro Variable Lists to Create Dynamic Data ...
www.sas.comThe output from the macro processor must be run back through the parser once more to ... to values which have been read from data sets and placed in the program data vector. We simply provide a macro variable name and the value to be assigned as …
Helland Cosmos Big Data and Big Challenges - microsoft.com
www.microsoft.com–Changed to deal with input and output streams • SCOPE is a high level declarative language for data manipulation –It translates very naturally into parallel computation 10 Scope Job Stream-1 Stream-2 Stream-3 Stream-A Stream-B Input Output Input Arrives as Sets of Records Computation Occurs as Sets of Records Output Written as
Title stata.com xtset — Declare data to be panel data
www.stata.comto use the xt commands. You do not need to set both, but it will not matter if you do. xtset and tsset are different, however, when you set just a panelvar—you type xtset panelvar— or when you set just a timevar—you type tsset timevar. If you save your data after xtset, the data will be remembered to be a panel and you will not